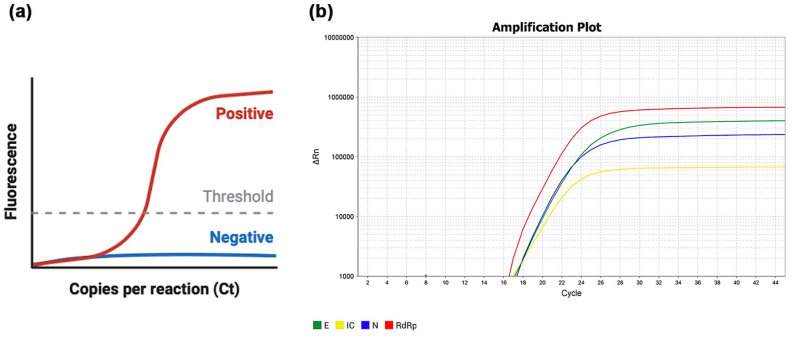
Figure 3.
Real-time reverse transcription polymerase chain reaction (rRT-PCR) of a salivary positive sample. (a) Schematic illustration of an rRT-PCR result. The amplification curve for positive samples follows a sigmoid trend (i.e., the relative fluorescence intensity increases, with an exponential middle tract, until a plateau phase). No increase in fluorescence is observed when the sample is negative. The threshold is placed so to intersect the amplification curves at the beginning of the exponential tract. The cycle threshold (Ct) represents the cycle number at which the amplification curve intersects the threshold line and is an indicator of the quantity of the amplified target gene. The lower the Ct value, the higher the amount of the target gene and then the viral load. (b) An example of amplification curves in log scale for a salivary sample that tested positive for the presence of all 3 genes associated with SARS-CoV-2 (E, N, and RdRp). The internal control (IC), whose viral load is known, is used as comparison to quantify the viral load of the sample.

