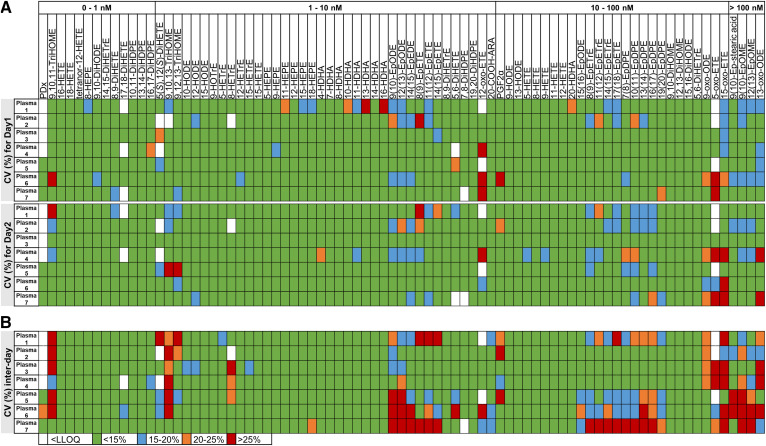
Fig. 1.
Intra-day (A) and inter-day (B) variability of the oxylipin analysis in laboratory 1. Oxylipin analysis in the seven QC plasmas was carried out in triplicate on two consecutive days in the reference laboratory (laboratory 1) and the variability within each day as well as the inter-day variability were determined. The CVs were calculated using the mean concentration and SD . Shown are the CVs of 81 quantified oxylipins in the seven plasmas in laboratory 1 displayed in four different colors.

