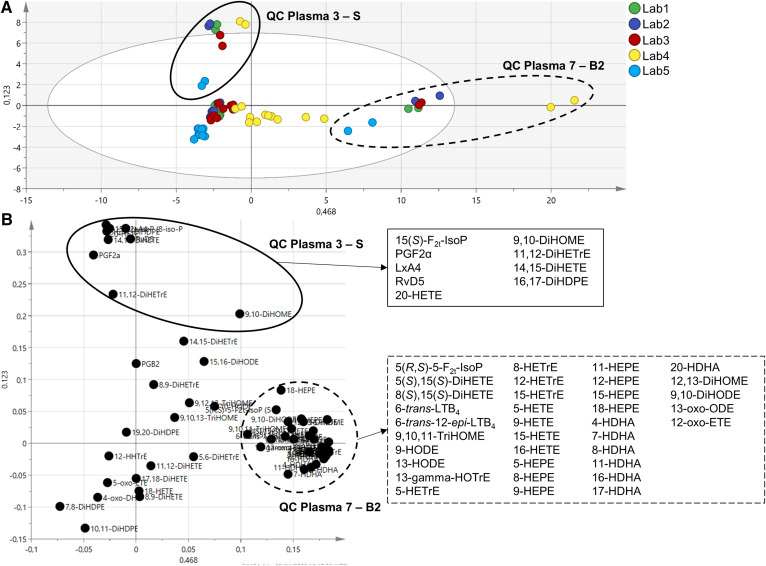
Fig. 2.
Principal components analysis (PCA) model without epoxy-PUFAs. The model was built with 75 samples and 62 oxylipins (R2X = 0.592 and Q2 = 0.544). A: The score plot shows that the main variability is related to the type of plasma: QC plasma 7 (B2) (dotted circle) and QC plasma 3 (S) (solid circle). B: The loading plot displays oxylpins contributing to the discrimination of QC plasmas 7 (dotted circle) and 3 (solid circle). Lists of these oxylipins are depicted in respective boxes.

