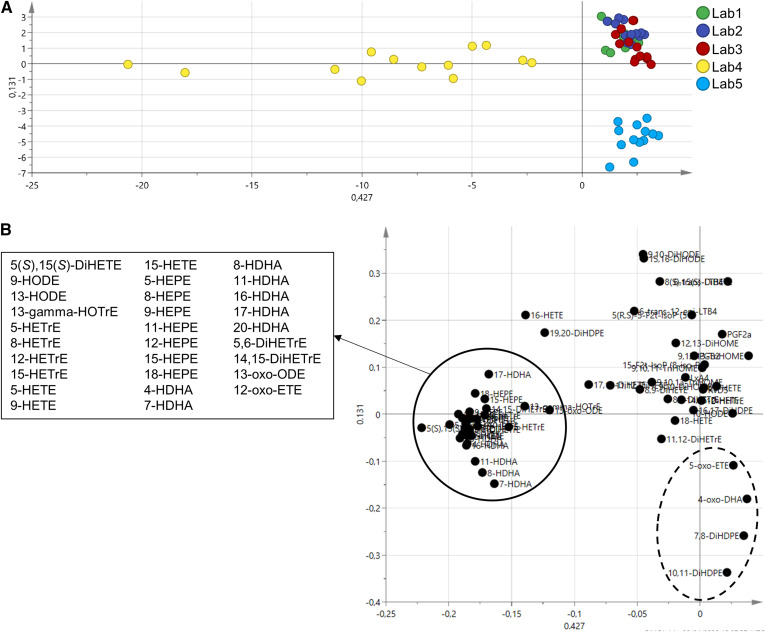
Fig. 3.
PLS-DA. The model was built with 65 samples and 62 oxylipins (R2Y = 0.78 and Q2 = 0.729). A: The cross-validated score plot shows that laboratories 4 and 5 distinguish themselves from the others. B: The loading plot shows the oxylipins contributing to the discrimination of laboratory 4 (solid circle); the list of these oxylipins indicates that this discrimination is driven by hydroxy-PUFAs. With less variability, four oxylipins (dotted circle) contribute to the discrimination of laboratory 5.

