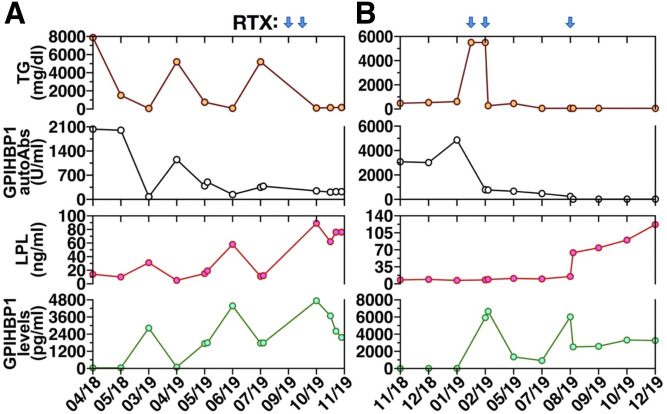
Fig. 8.
Plasma triglyceride levels (TG, brown circles), GPIHBP1 autoantibodies (autoAbs, black circles), LPL mass (red circles), and GPIHBP1 mass levels (green circles) in two patients with the GPIHBP1 autoantibody syndrome. Values are shown both before and after treatment with rituximab (RTX); blue arrows indicate timing of RTX infusions. A: TG, GPIHBP1 autoantibodies, LPL mass, and GPIHBP1 mass measurements in a GPIHBP1 autoantibody patient (patient 13 in Table 1) described by Ashrafi et al. (75). Panel A modified, with permission, from the publication by Ashraf et al. (75). B: TG, GPIHBP1 autoantibodies, LPL mass, and GPIHBP1 mass measurements in a GPIHBP1 autoantibody patient (patient 11 in Table 1) described by Lutz et al. (76).

