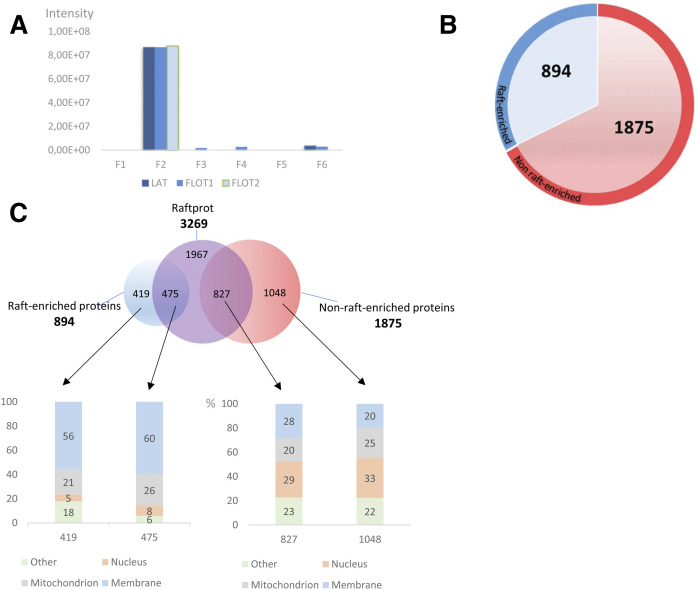
Fig. 4.
Purity of raft preparation and generation of a T cell raft protein database. T cells were immunoselected from four mice and subjected to raft isolation by the simplified OptiPrep™ density gradient procedure. Then, proteins were extracted separately by the S-Trap method, pooled, and analyzed by MS. A: Intensities calculated by MaxQuant for three raft markers, namely LAT, flotillin-1 (FLOT1), and flotillin-2 (FLOT2) in all six OptiPrep™ gradient fractions. B: Representation of the generated T cell raft protein database. Proteins are divided into those enriched in rafts (abundance ratio in raft over nonraft fractions <2, red color). C: Protein comparison of generated database with RaftProt database and Gene Ontology analysis. The number of exclusive and common proteins is indicated for each case in the upper diagram. The columns in the lower side indicate the percentage of proteins corresponding to each case in the upper diagram. The columns in the lower side indicate the percentage of proteins corresponding to each cellular compartment, according to Gene Ontology.

