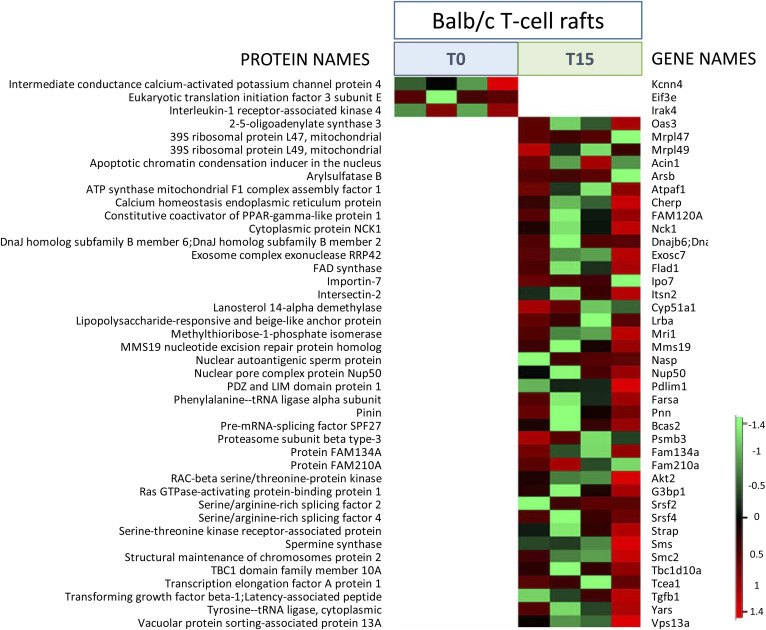
Fig. 5.
Raft protein analysis on Balb/c T cells with or without anti-CD3/CD28 TCR activation. Heatmap representation from Perseus software of proteins detected (in color) or not detected (in white) in T cell rafts from four individual mice. T cells immunoselected from each mouse were split and either nonstimulated (T0) or stimulated for 15 min (T15) with anti-CD3/anti-CD28 antibodies. The color scale denotes abundance variation (red for more abundant, green for less abundant).

