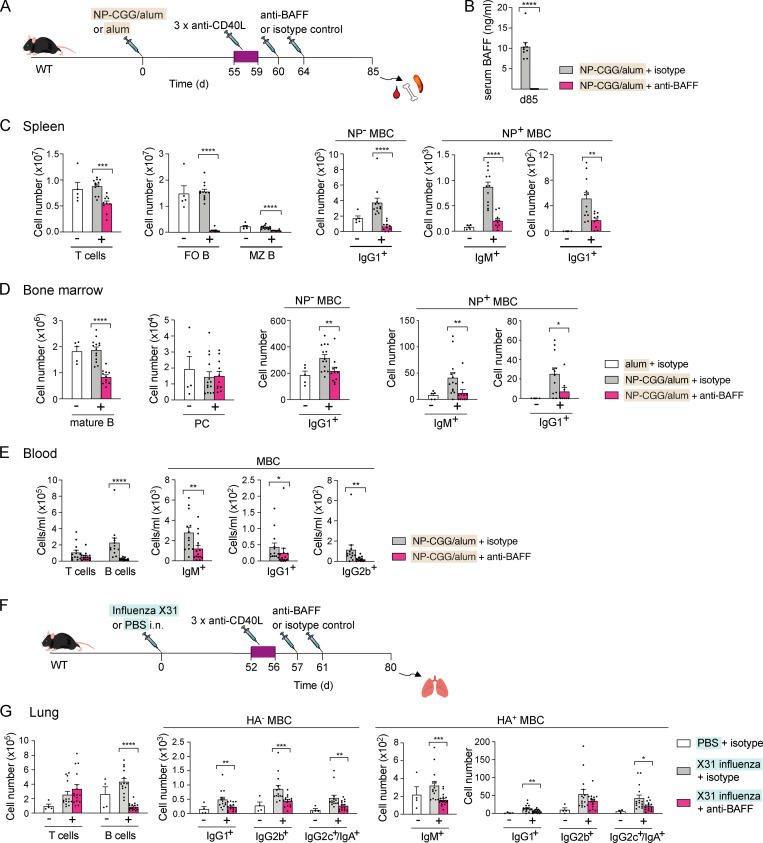
Figure 5.
BAFF depletion results in the loss of MBCs. (A) WT mice were immunized with NP-CGG in alum or alum alone on day 0, followed by anti-CD40L or isotype control antibody injections on days 55, 57, and 59. Anti-BAFF or isotype control antibody was injected on days 60 and 64. (B) Mean (±SEM) BAFF levels in serum of mice immunized with NP-CGG in alum 21 d after anti-BAFF (n = 11) or isotype control antibody (n = 9) injection. Each dot represents one mouse. (C–E) Mean (±SEM) numbers of B cell populations in spleen (C), bone marrow in two legs (D), or blood (E) of mice immunized with NP-CGG in alum (+; n = 10 for anti-BAFF and n = 12 for isotype control antibody in spleen; n = 11 for anti-BAFF and n = 14 for isotype control antibody in bone marrow; and n = 15 for anti-BAFF and n = 13 for isotype control antibody in blood) or alum alone (−; n = 5) as described in A, 21 d after last anti-BAFF or isotype control antibody injection. Splenic T cells (CD3+CD138−B220−), FO (FO B, CD3−CD138−B220+Fas−AA4.1−PD-L2−IgMloCD23+), MZ (MZ B, CD3−CD138−B220+Fas−AA4.1−PD-L2−IgMhiCD23−), and NP+ IgG1+ and IgM+ MBCs and NP− IgG1+ MBCs (CD3−CD138−B220+Fas−AA4.1−PD-L2+), bone marrow mature B cells (CD138−B220hiIgM+), PCs (B220−CD138hi), and NP− IgG1+ MBCs and NP+ IgM+ and IgG1+ MBCs (CD138−B220hiPD-L2+), and blood T cells (CD3+B220−), B cells (CD3−B220+CD138−), and IgM+, IgG1+, or IgG2b+ MBCs (CD3−B220+CD138−PD-L2+) were analyzed using the gating strategy shown in Fig. S4 B. Each dot represents one mouse. (F) WT mice were infected i.n. with X31 influenza or given PBS as a control on day 0, followed by anti-CD40L or isotype control antibody injections on days 52, 54, and 56. Anti-BAFF or isotype control antibody was injected on days 57 and 61. (G) Mean (±SEM) numbers of cell populations in lungs of mice infected with X31 influenza (+; n = 16 for anti-BAFF and n = 14 for isotype control antibody) or given PBS as a control (−; n = 4) 19 d after last anti-BAFF or isotype control antibody injection. Pulmonary T cells (CD3+CD19−), total B cells (CD3−CD138−CD19+), and HA+ IgM+, IgG1+, IgG2b+, and IgG2c+/IgA+ and HA− IgG1+, IgG2b+, and IgG2c+/IgA+ MBCs (CD3−CD138−CD19+PD-L2+) were analyzed using the gating strategy shown in Fig. S4 D. Data pooled from two (C–E) and three (G) independent experiments. Mann-Whitney test was used for statistical analysis. *, 0.01 < P < 0.05; **, 0.001 < P < 0.01; ***, 0.0001 < P < 0.001; ****, P < 0.0001.

