
Fig. 2.
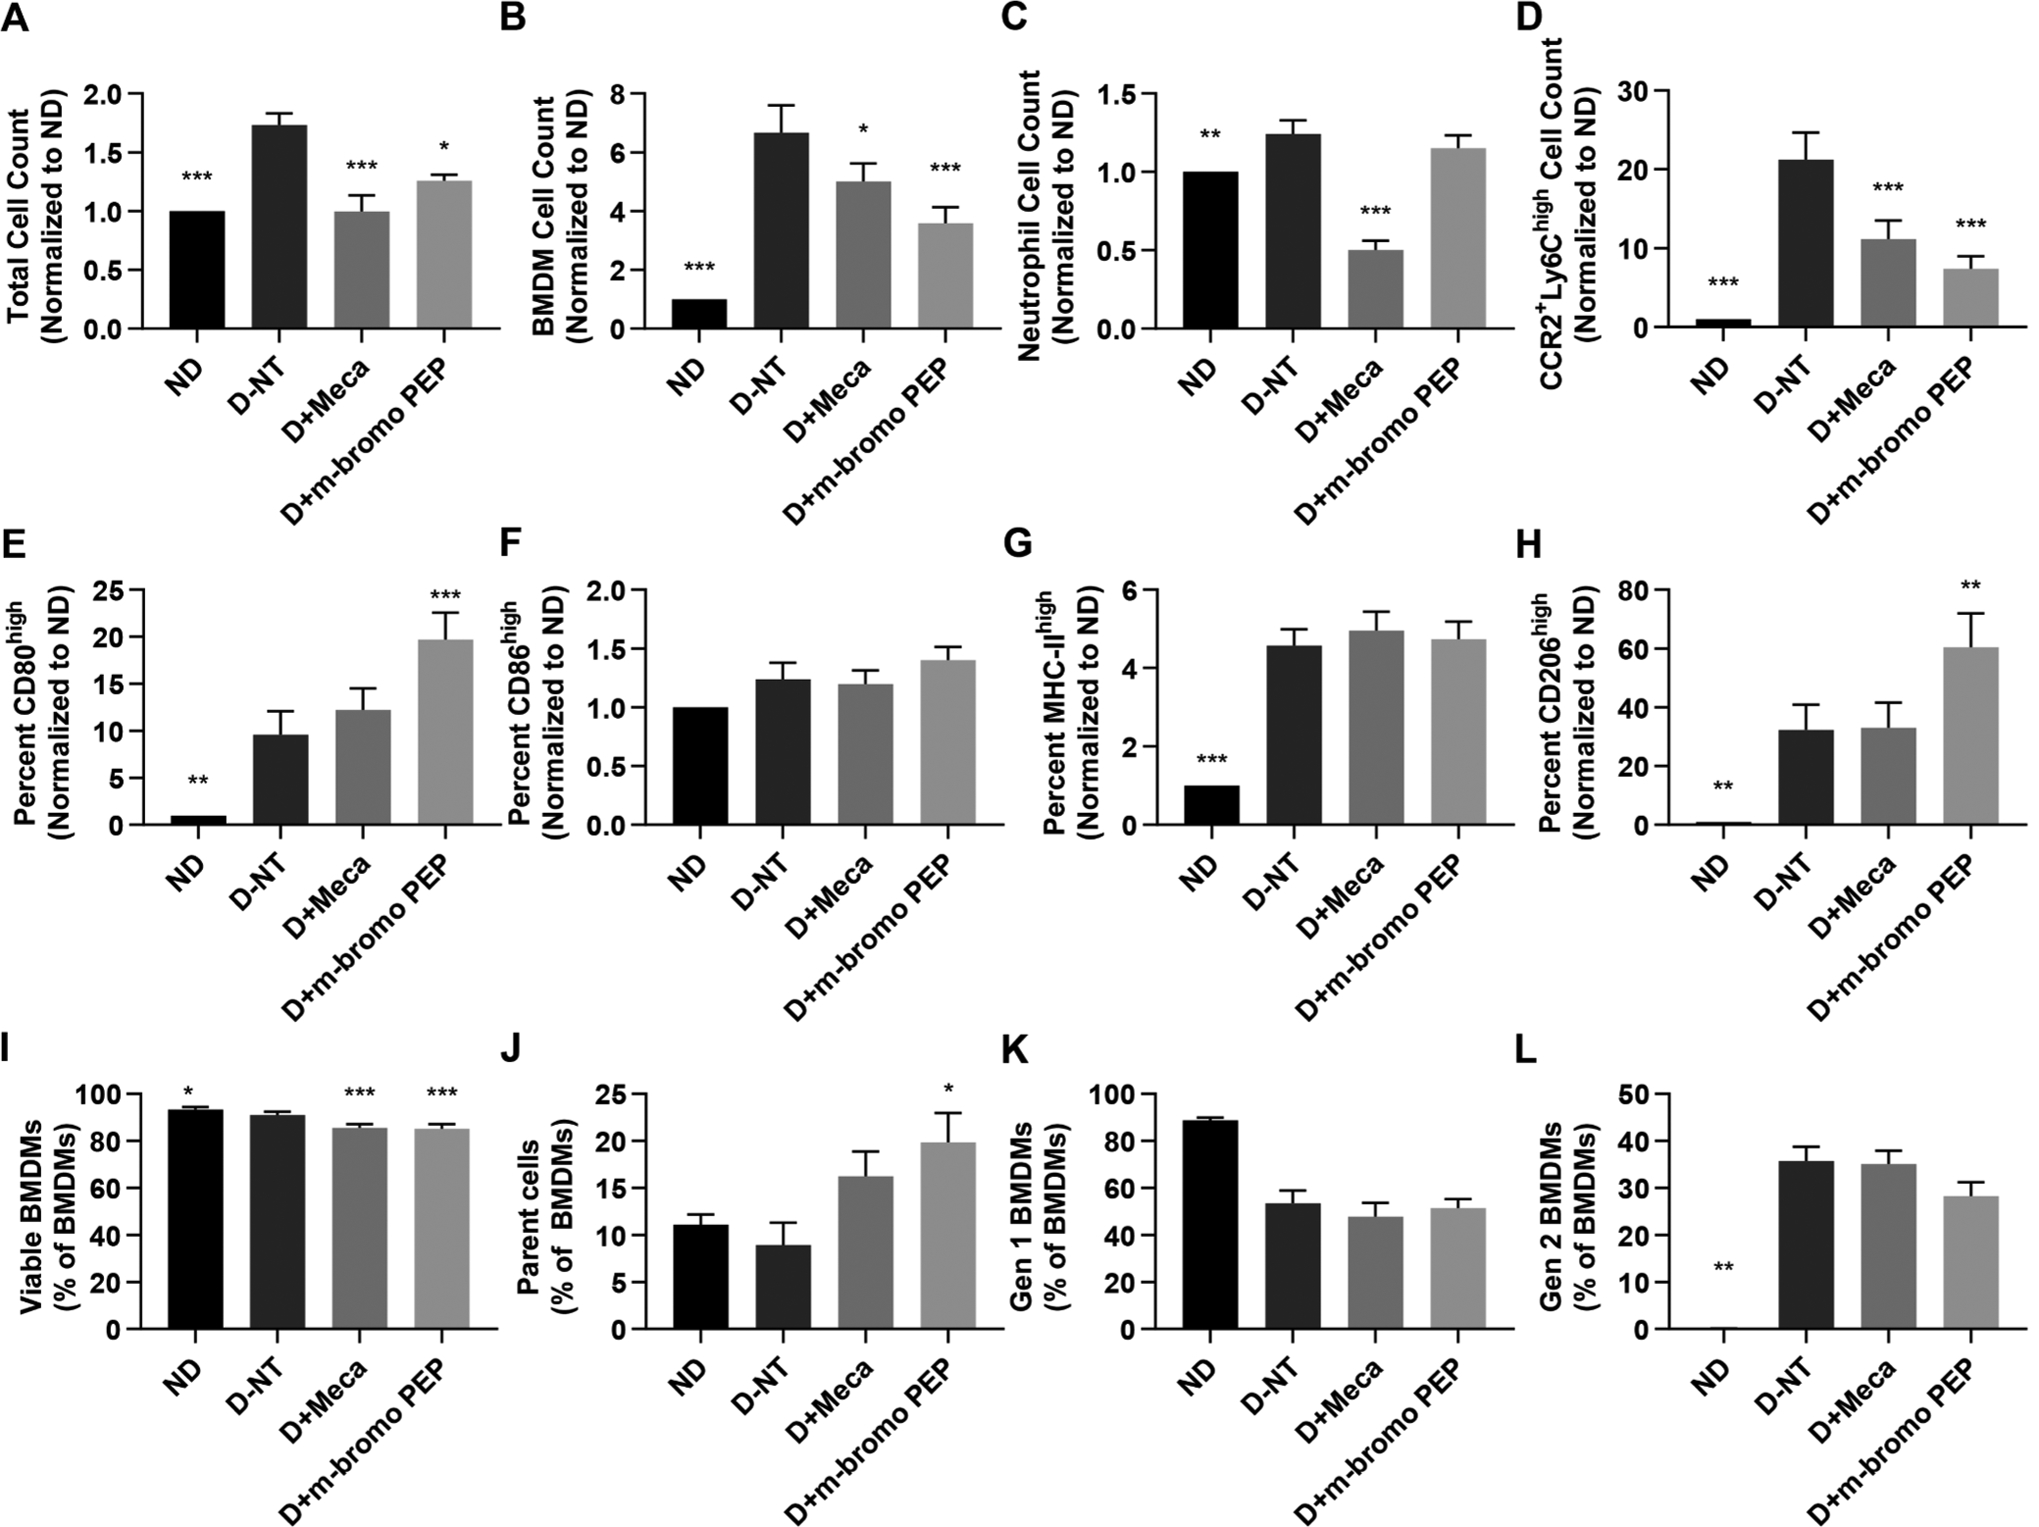
Mecamylamine and m-bromo PEP alter the abundance and phenotype of mouse BMDMs. Bone marrow cells were freshly isolated from C57BL/6J mice. Cells from each individual mouse were separated and cultured for 3 days in one of the following four conditions: non-differentiated (ND), in the presence of M-CSF and IFNγ to induce M1 BMDM differentiation with no drug treatment (D-NT), M1 differentiation with 100 μM mecamylamine (D + Meca) or M1 differentiation with 100 μM m-bromo PEP (D + m-bromo PEP). Cells were counted manually and further analyzed by flow cytometry. Data from panels A-H were normalized to the ND control. A, Total cell counts following the 3 days of cell culture (n = 8). B-D, Total BMDM (B, n = 9), neutrophil (C, n = 8) and M1 (CCR2+Ly-6Chigh) BMDM (D, n = 9) cell numbers in each treatment group. E-H, Proportions of BMDMs that express high levels of CD80 (E, n = 8), CD86 (F, n = 8), MHC-II (G, n = 9) and CD206 (H, n = 9). I, Proportions of viable BMDMs (n = 8). J-L, Proportions of BMDMs that were parent cells (J, n = 4), 1st generation cells (K, n = 4) or 2nd generation cells (L, n = 4) after the 3 days of culture. Data are presented as means ± SEM. For A-I, data were analyzed by repeated-measures one-way ANOVA with multiple comparisons using Dunnett’s correction. For J-L, data were analyzed using the Friedman test with Dunn’s correction for multiple comparisons. *P < 0.05; **P < 0.01; ***P < 0.001 vs D-NT.