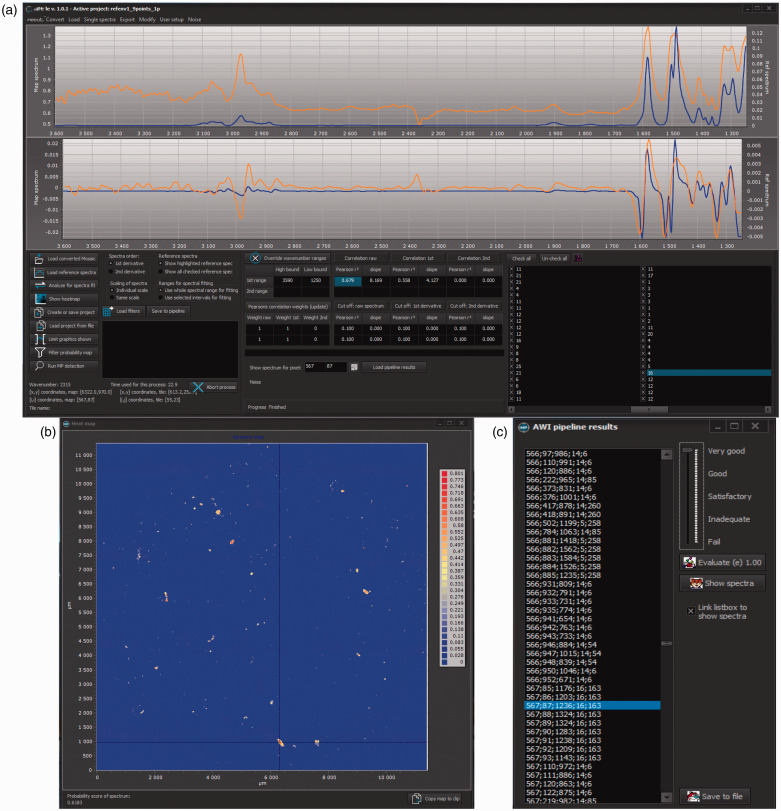
Figure 2.
Quality assurance/quality control for siMPle for results of the image analysis of sample RefEnv124 via the AWI pipeline allowing a direct comparison (a) between sample spectrum (orange) and database spectrum (blue) by clicking on the determined pixel (c). The process allows checking other spectra by clicking on another database entry as well as the individual Pearson correlation factors. The heatmap (b) allows the user to locate the assigned spectra on the map.

