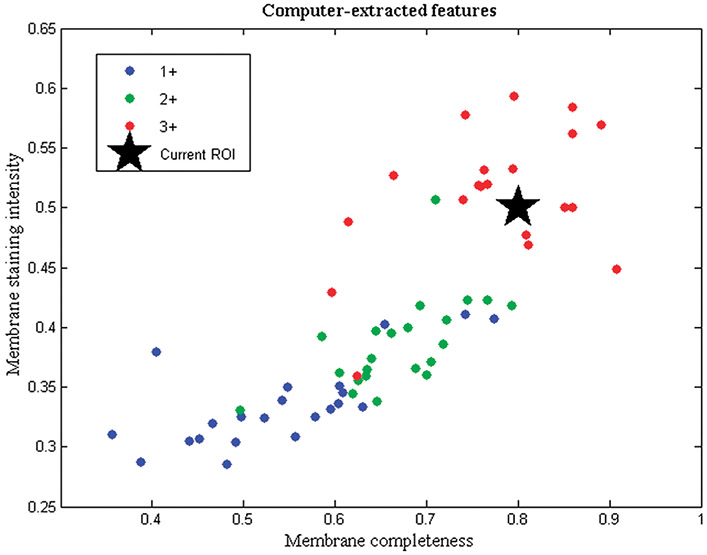
Figure 2.
Feature plot shown concurrently with HER2 images in the computer-aided mode of the observer study. The plot shows membrane completeness and membrane staining intensity values of a testing image (star prompt) relative to the values of slides in 1+, 2+, and 3+ categories. Abbreviation: ROI, region of interest, refers to the image shown.

