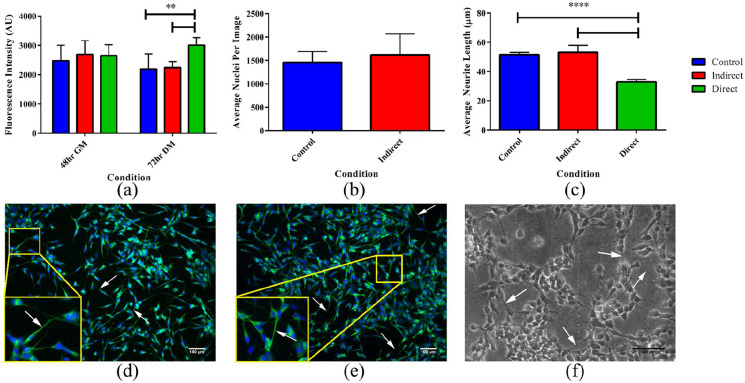
Figure 7.
Graphs and images from the cell culture study. (a) AlamarBlue® assay data after 48 h in GM and after 72 h in DM, a significant difference in fluorescence observed between the direct and control condition and between the direct and indirect condition after 72 h in DM. (b) Average nuclei count for the different conditions. (c) Average neurite length for the different conditions measured from the fluorescently stained images and from the phase contrast image (for the direct condition). A significant difference in neurite length observed between the direct and control condition and between the direct and indirect condition. Data presented as mean ± standard deviation from N = 3 experimental repeats in each condition. *P ⩽ 0.05, **P ⩽ 0.01, ***P ⩽ 0.001, ****P ⩽ 0.0001. (d) Fluorescently stained SH-SY5Y cells from the control condition (no hydrogel present). (e) From the indirect condition (culture medium previously used for soaking hydrogels). (f) Phase contrast image of the SH-SY5Y cells grown directly on the hydrogel surface. Arrows indicate the location of neurites.

