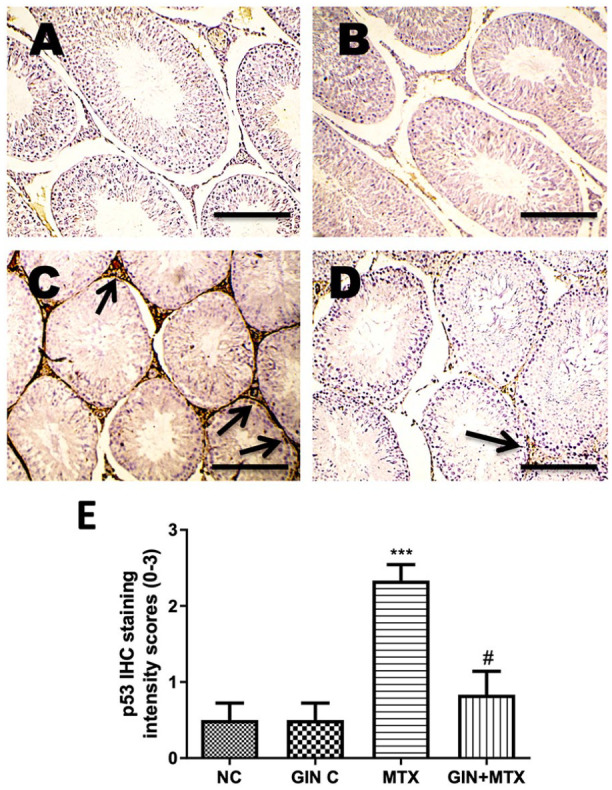
Figure 6.

Microscopic pictures of rats’ testes immunostained against apoptotic p53 (A–D) and statistical analysis of IHC intensity scores of p53 expression (E). Testicular sections showed a weak positive brown staining for p53 expression in the NC and GIN C groups (A and B), a strong positive brown staining for p53 expression in the MTX group (C), a moderate positive brown staining for p53 expressions in the GIN+MTX treated group (D). IHC counterstained with Mayer’s hematoxylin. X100, bar = 100 µm. ***P < .05 versus NC, #P < .05 versus MTX.
