Figure 3:

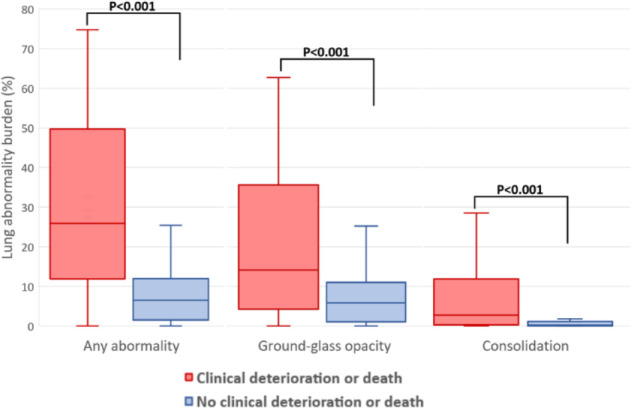
Burden of lung abnormalities on CT in patients with versus without clinical deterioration or death. Box plots demonstrate the median, interquartile range 25th-75th, and minimum and maximum values.

Burden of lung abnormalities on CT in patients with versus without clinical deterioration or death. Box plots demonstrate the median, interquartile range 25th-75th, and minimum and maximum values.