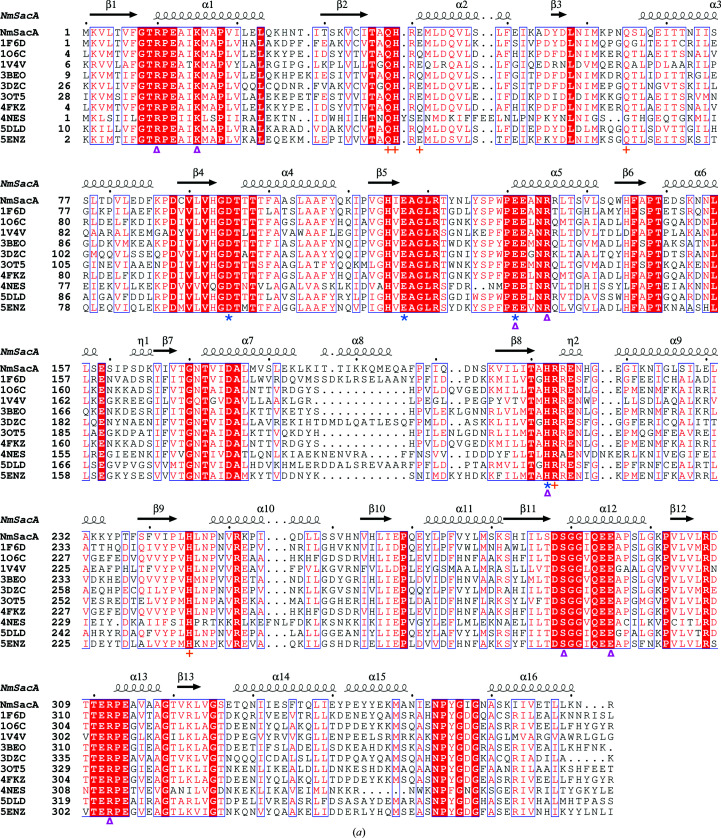
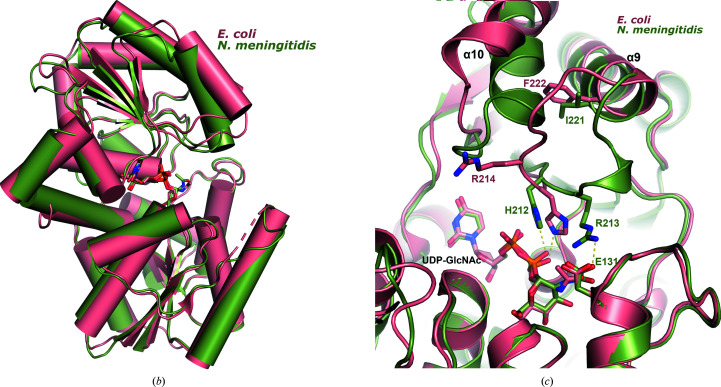
Figure 5.
Comparison of bacterial nonhydrolyzing UDP-GlcNAc 2-epimerases. (a) Sequence alignment of all known bacterial UDP-GlcNAc 2-epimerase structures in the PDB. The secondary-structure elements defined by the NmSacA structure are drawn above the sequence alignment. Red boxes indicate residues that are conserved in all epimerases. The putative catalytic residues are designated by blue asterisks below the sequence, residues that bind UDP-GlcNAc substrate are designated by magenta triangles and residues that are observed to bind the UDP-GlcNAc allosteric effector in other epimerase structures are represented by orange crosses. (b) Superposition of substrate-bound NmSacA (green) on substrate-bound E. coli epimerase (salmon; PDB entry 1vgv). UDP-GlcNAc is shown in stick representation. The r.m.s.d. ranges between 0.655 and 0.949 Å (300 Cα atoms) on comparing the two substrate-bound monomers from each structure. (c) Close-up view of the active site, revealing the major structural difference between the two epimerases: a shift of helix α10 and the β9–α9 loop. Residues are labeled in their respective colors for each epimerase. Yellow dashed lines represent interactions.


