
Figure 4.
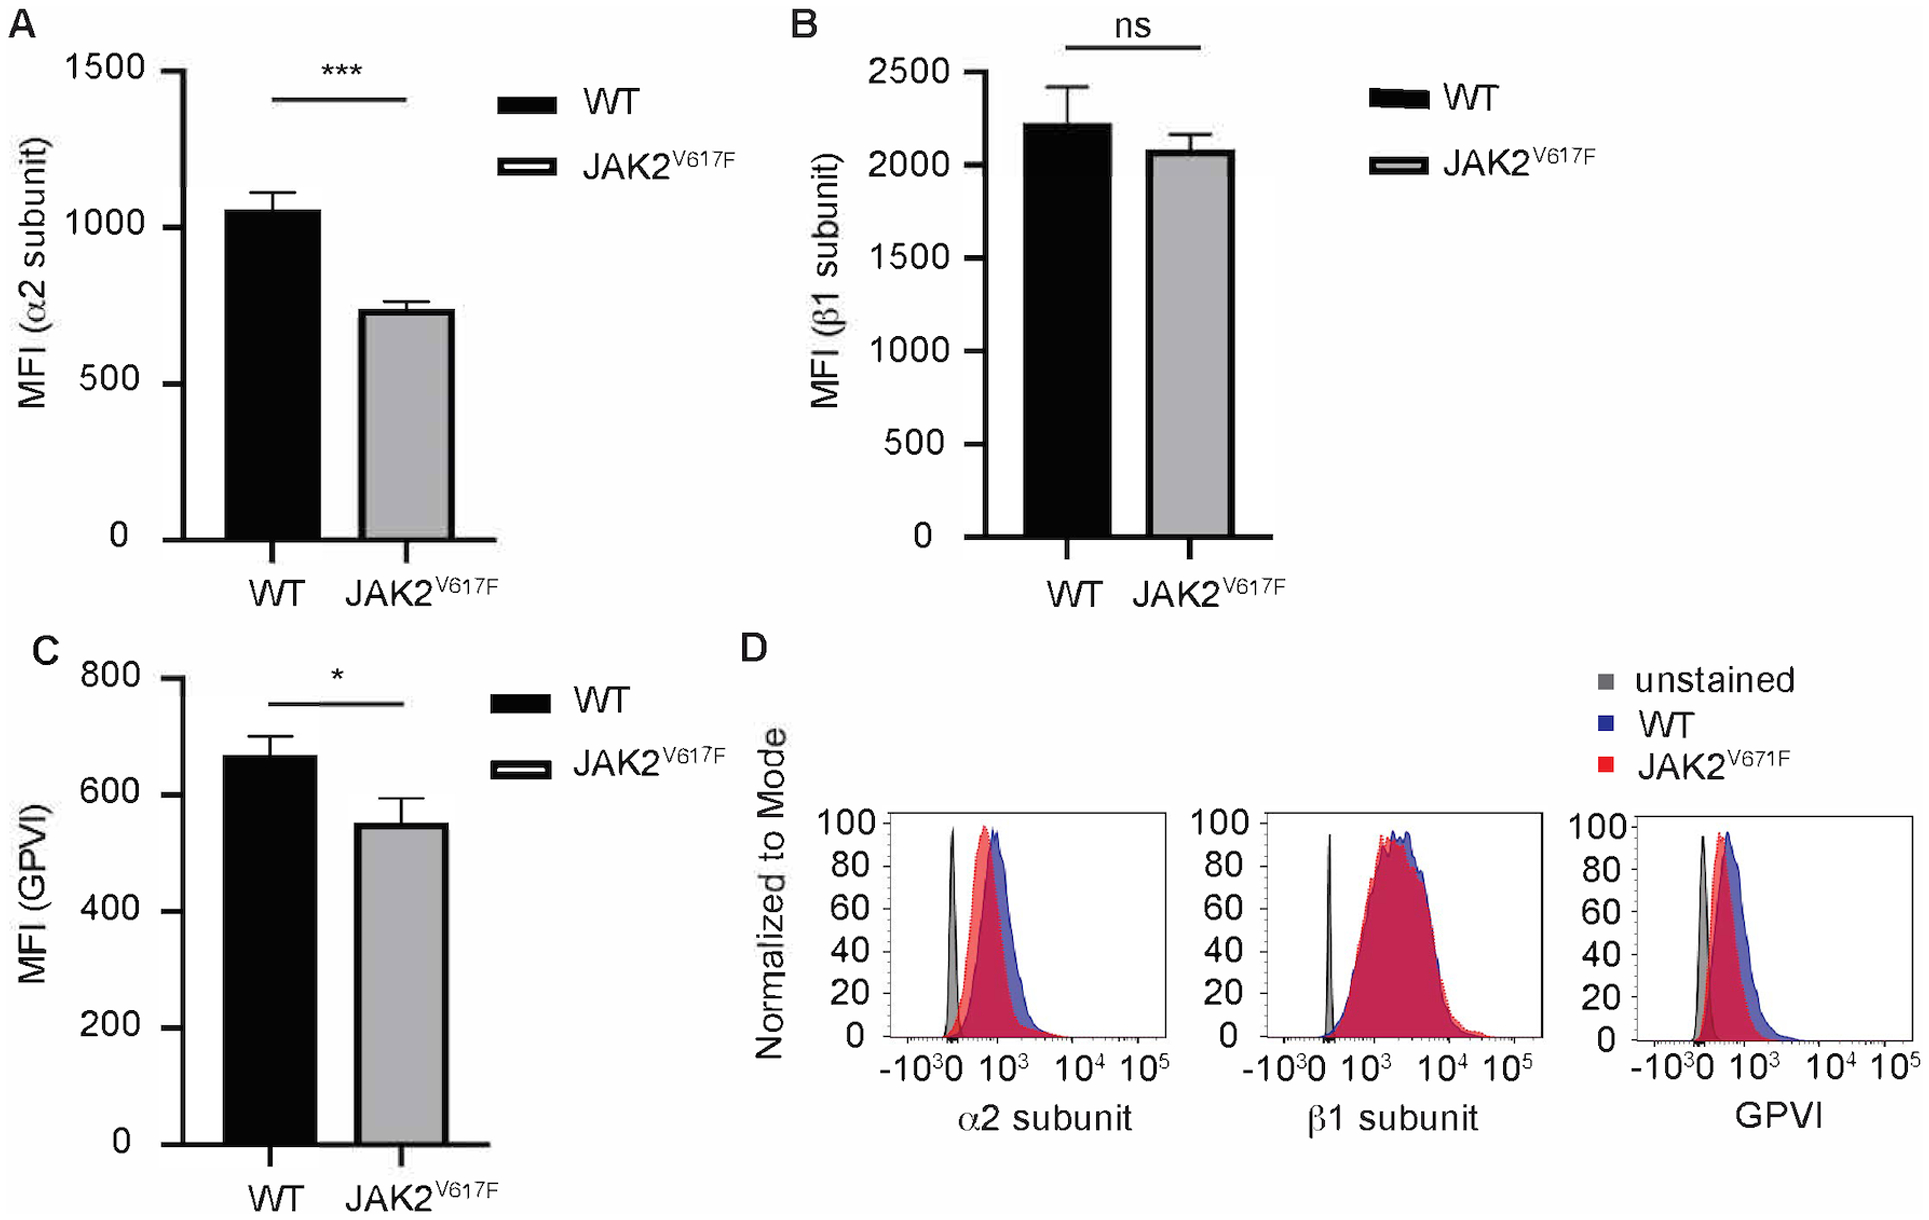
JAK2V617F platelets show decreased cell surface levels of α2 integrin subunit and GPVI. Platelets derived from JAK2V617F and WT mice (as in Figure 3) were subjected to flow cytometry analysis to measure cell surface α2 integrin subunit (A), β1 integrin subunit (B), and GPVI (C), using antibodies as described under Methods. A representative flow cytometry tracing is shown in panel D. Data are averages +/−SD. 15 weeks old male WT and JAK2V617F mice (n=3 each). ns: not significant, *p<0.05; ***p< 0.001.