
Figure 6.
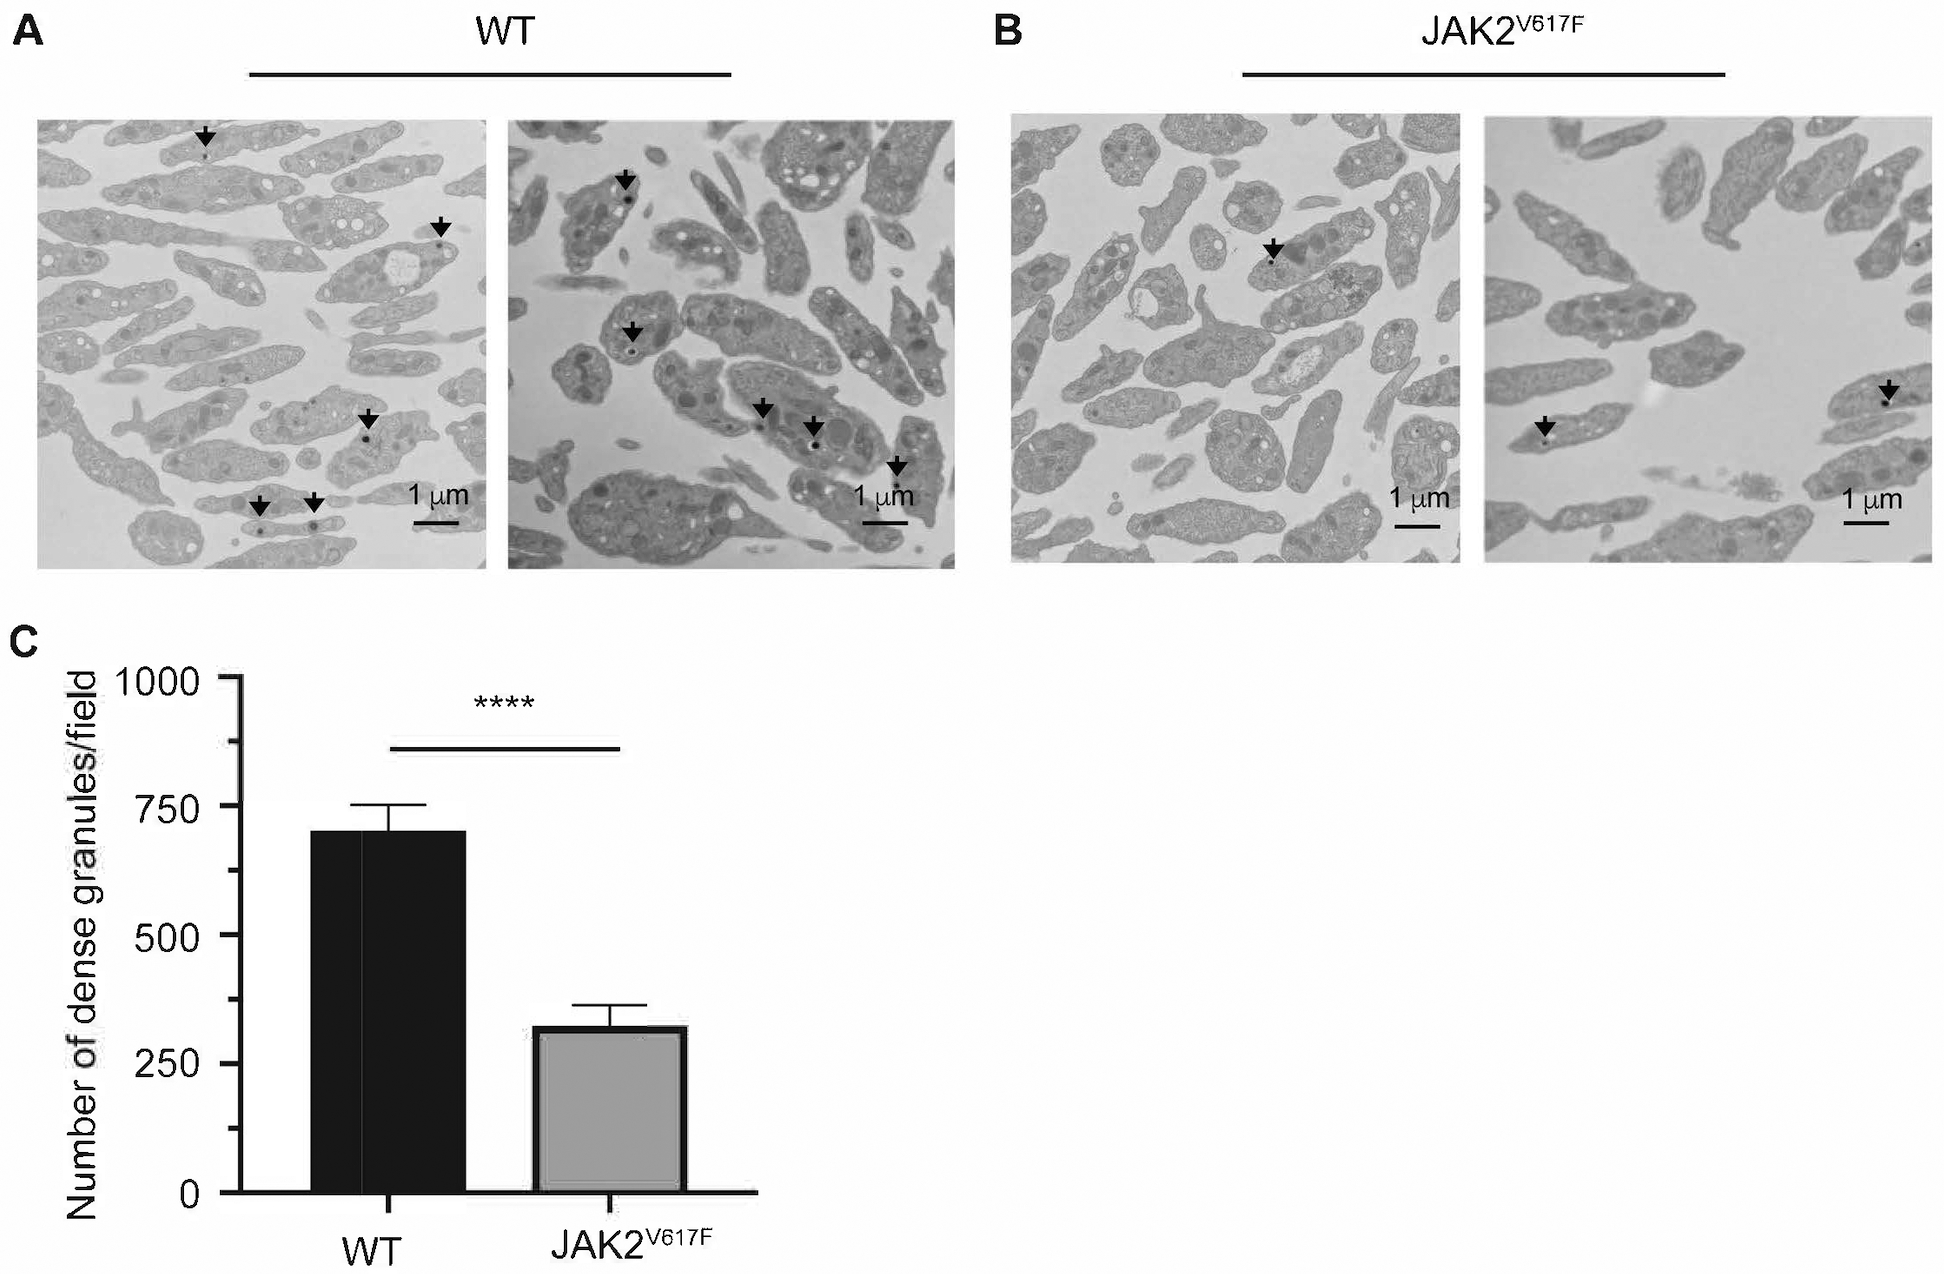
EM reveals a dense granule deficiency in JAK2V617F mice. Representative images of EM analysis of platelets derived from two WT (A) or JAK2V617F (B) male mice (about 30 weeks old). Black arrows represent dense granules found in platelets. C. Quantification of dense granules. Shown are averages+/−SD of 41 fields and 27 fields analyzed for WT and JAK2V617F mice, respectively. Mann Whitney was performed as a two tailed test using the Prism software. **** p <0.0001.