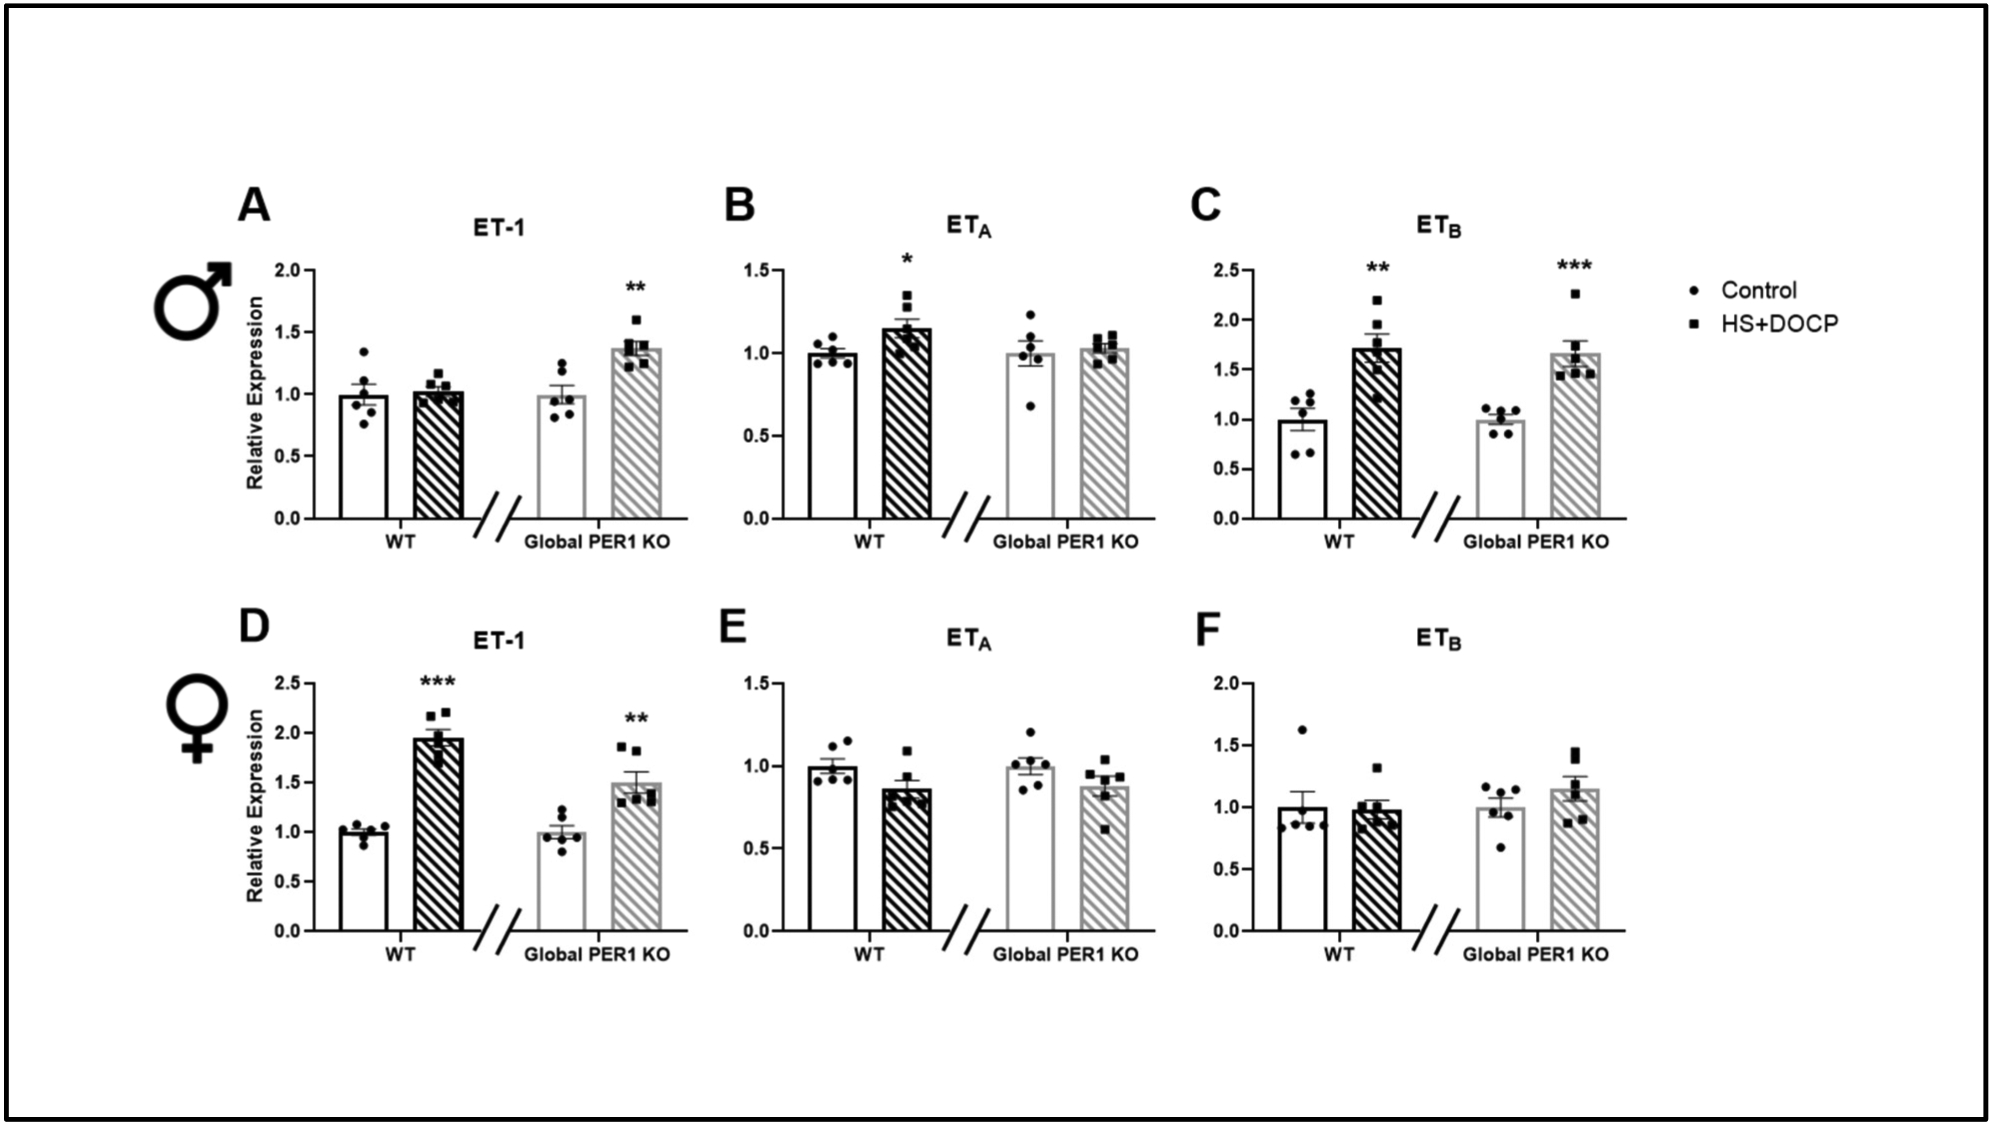
Figure 3: Gene Expression Analysis of the ET-1 Axis in Response to HS+DOCP Treatment.

Kidney cortex samples were isolated at noon, the midpoint of the mouse rest period, from male (A-C) and female (D-F) WT and global PER1 KO mice on NS or HS/DOCP for 3 days. Total RNA was isolated from the dissected renal cortex samples and measured by quantitative real time RT-PCR. To look at the gene expression changes in response to the HS/DOCP treatment, expression was relativized to NS expression within each genotype. N=6 mice per group, statistically significant effect of HS/DOCP treatment on gene expression was determined by T-test (*P<0.05, **P<0.01, ***P<0.001).
