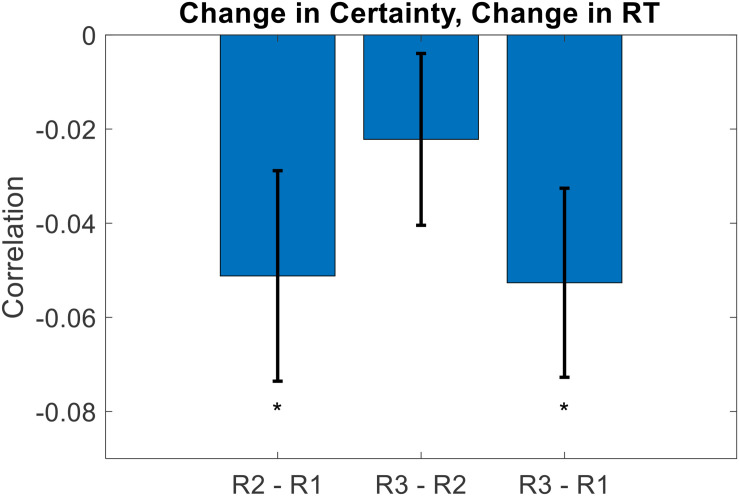
FIGURE 6.
Across participants, the change in value rating certainty negatively correlated with the change in value rating RT. The idea here is that on an item-by-item basis, as certainty increases (across repeated ratings), it takes the DM less time to decide upon a rating estimate (error bars represent s.e.m., significance stars represent: *p < 0.05).

