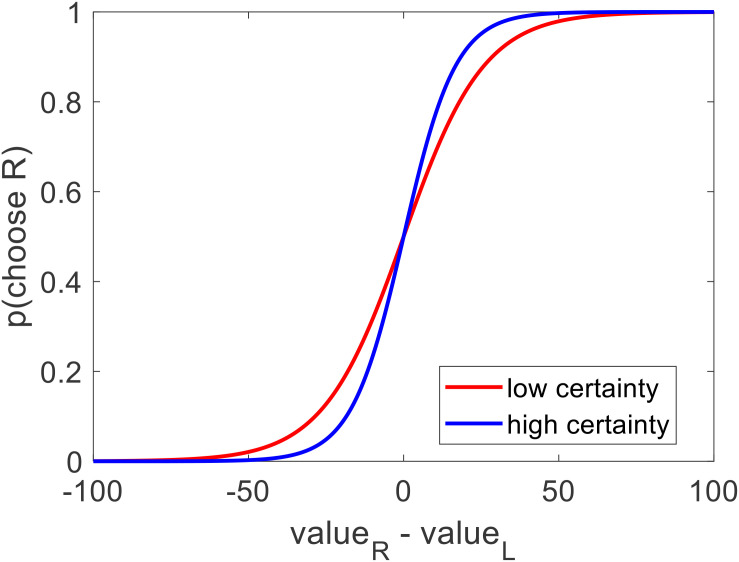
FIGURE 7.
Across participants, the probability of choosing the option on the right increased as a function of the value estimate difference (right option – left option). In particular: choices that were made between options with low value certainty (red curve, within subject median split) were more stochastic than choices that were made between options with high value certainty (blue curve) (left plot).

