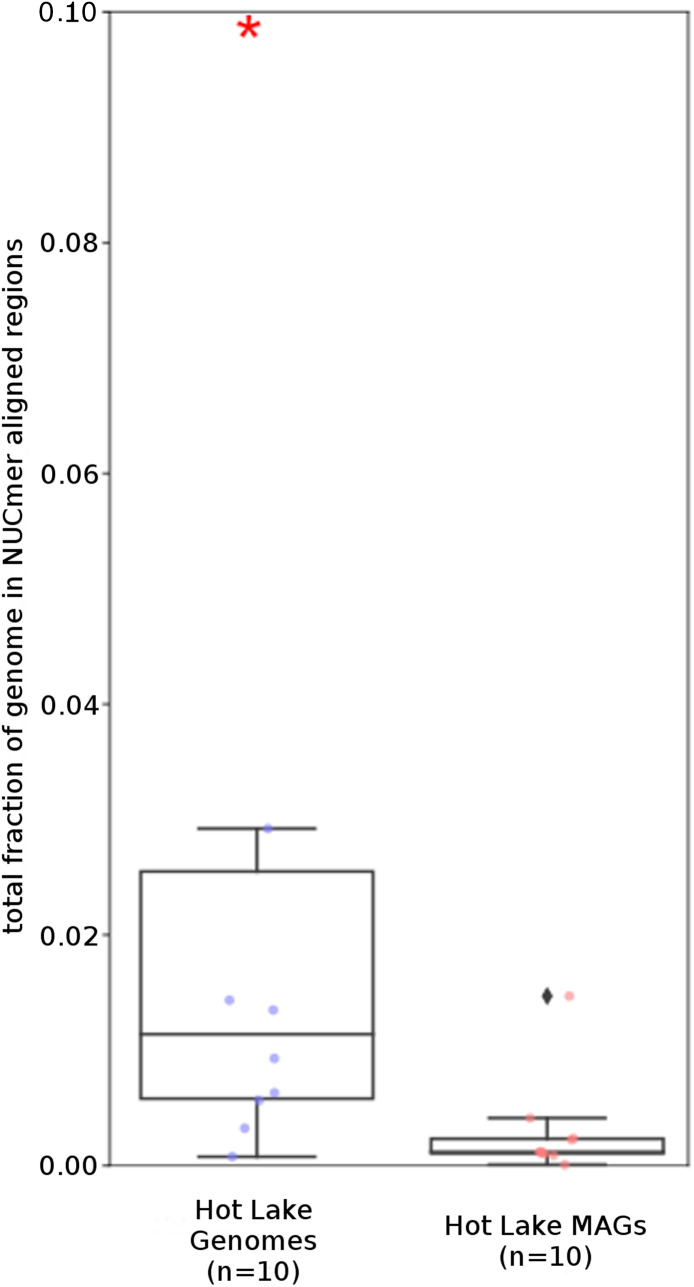
Figure 3. Repeat content of genomes vs MAGs.
Box plot representation of the total fraction of each genome/MAG in a repeat region as determined by NUCmer (≥97% identity; center line, median; box limits, upper and lower quartiles; whiskers, 1.5× interquartile range; diamonds, outliers). UCC MAG and genome comparison were significantly different (p = 0.01; Mann–Whitney U). Red asterisks denote the existence of outliers outside of the displayed dataset.

