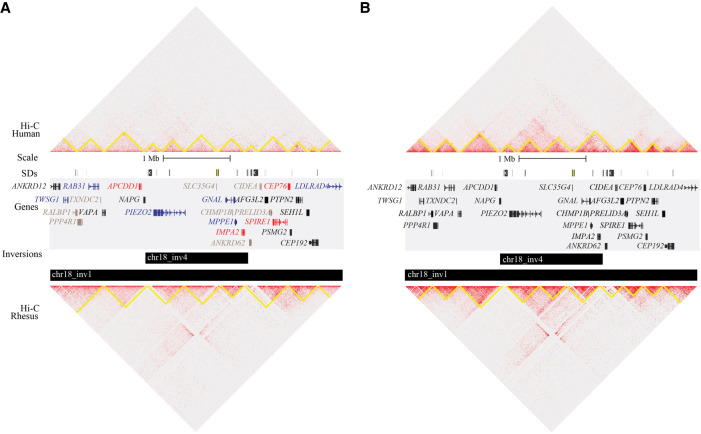
Figure 4.
Comparison of chromatin structure and gene expression at a selected inversion (Chr18_inv4). Coordinates depicted are Chr 18: 9,140,001–13,490,000 (GRCh38). (A) Hi-C heatmap of human (top) and macaque (bottom) LCLs with predicted chromatin domains outlined in yellow, visualized in Juicebox. SDs are shown as colored blocks in the top track (taken from the UCSC Genome Browser). Genes are colored by differential expression: Red genes are up-regulated in macaque relative to human, blue genes are down-regulated, black genes are not differentially expressed, and gray genes were not tested. (B) The same locus is depicted with fibroblast Hi-C data. No differential expression analysis was conducted in fibroblasts.

