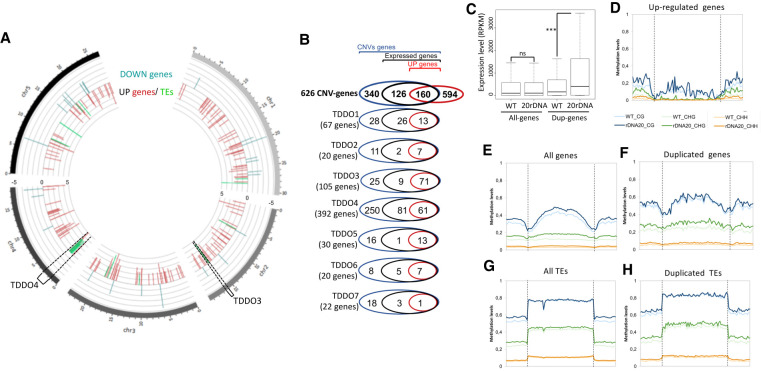
Figure 5.
Impact of TDDO on global gene expression and cytosine methylation in L6F6. (A) Representation of the chromosomal position of genes (red bars) and TEs (green bars) of differentially accumulated transcripts in the 20rDNA L6F6 versus WT Col-0 with an adjusted P-value < 0.01 and a log2(fold change) > 2. Data are displayed using Circos (Krzywinski et al. 2009). The brackets display the position of TDDO3 and TDDO4. (B) Venn diagrams representing the proportion of expressed genes (containing at least two reads/genes in wild-type) and up-regulated genes (P-value < 0.01, FC > 2) among all the duplicated genes or in each TDDO in L6F6. (C) Dot plot revealing the relative expression of all genes or duplicated (DUP) genes in leaves of 3-wk-old plants in WT Col-0 or in 20rDNA L6F6. (***) P-value = 0.0005 was calculated using a Wilcoxon test. (D–H) Global DNA methylation analyses from genome-wide bisulfite sequencing experiments in WT Col-0 versus the 20rDNA L6F6. Global CG, CHG, and CHH methylation are shown for up-regulated genes with an adjusted P-value < 0.01 and a log2(fold change) > 1.5 (D), all genes (E), duplicated genes (F), all TEs (G), and duplicated TEs (H).

