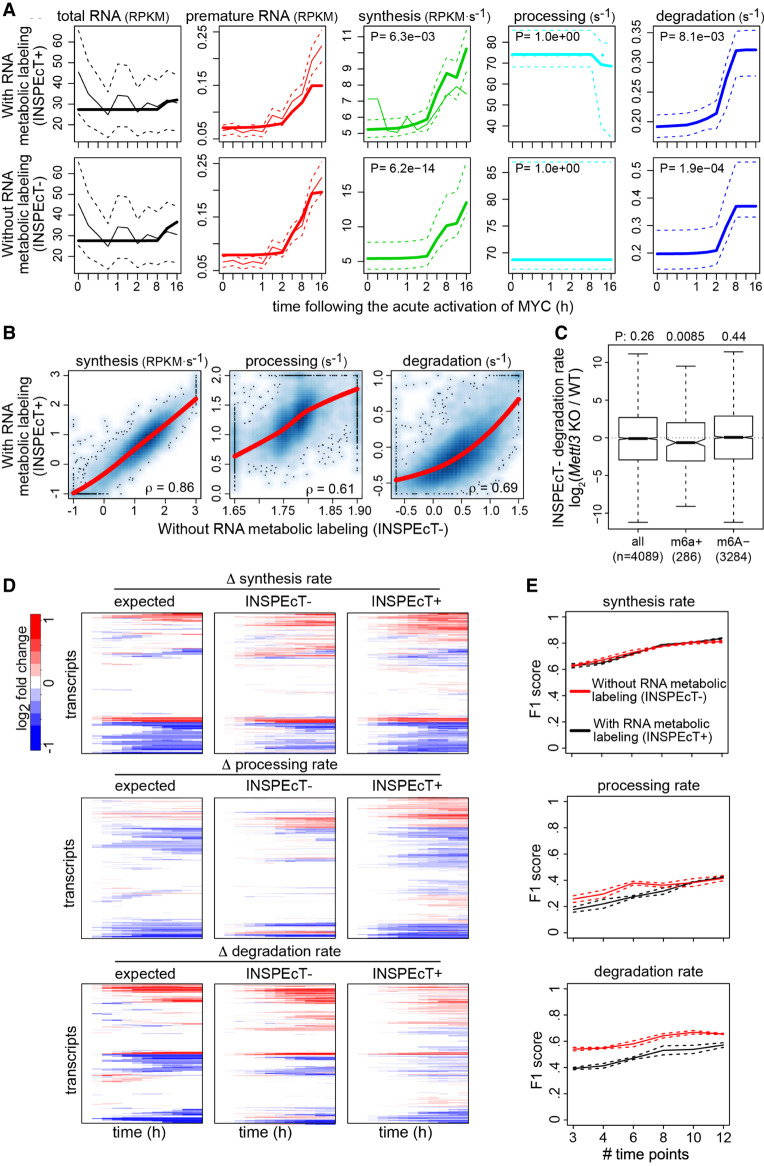
Figure 4.
Validation of INSPEcT− kinetic rates. (A) H2bc6 RNA dynamics quantified in 3T9 mouse fibroblast cells following the acute activation of MYC with (INSPEcT+) and without (INSPEcT−) RNA metabolic labeling. Solid bold lines indicate the model fit; thin solid and dashed lines indicate mean and standard deviation of experimental data for total and premature RNA; dashed lines indicate 95% confidence intervals for the kinetic rates models. (B) Scatter plots of RNA kinetic rates quantified in untreated 3T9 cells using INSPEcT+ and INSPEcT−. Regression curves and Spearman's correlation coefficients are indicated within each panel. (C) Boxplot of the changes in degradation rates during the differentiation of T cells quantified with INSPEcT−. Rates changes are displayed for m6A+, m6A−, or all RNAs in untreated cells. One-tailed Wilcoxon test P-values are displayed on the top. (D) Temporal changes of the RNA kinetic rates for simulated genes, relative to the initial time point (left), compared with those quantified through INSPEcT+ (middle) and INSPEcT− (right). (E) For each kinetic rate, quantified with or without metabolic labeling data, F1 scores are reported that measure the quality of the classification (P-value cutoff 0.05), considering both precision and recall. Score means and standard deviations are reported based on three simulated data sets obtained at increasing number of time points.

