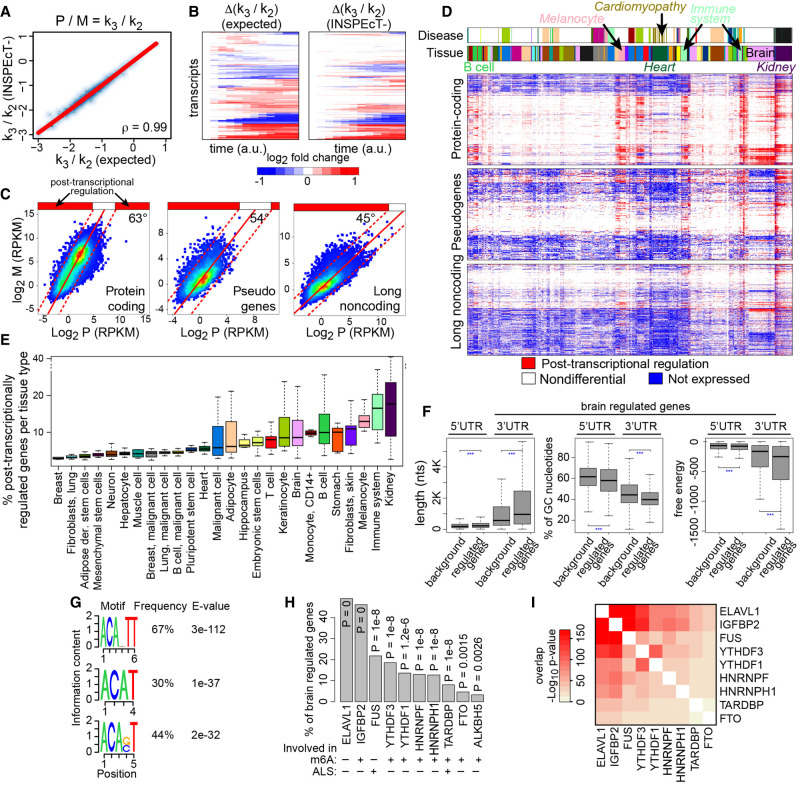
Figure 7.
Characterization of steady-state RNA dynamics: reanalysis of 620 RNA-seq data sets with INSPEcT−. At steady state, the ratio between premature (P) and mature (M) RNA corresponds to the ratio between degradation (k3) and processing (k2) rates. Absolute values (A) and the temporal variation (B) of k3/k2 ratios determined by INSPEcT− on simulated data were compared to the ground truth (“expected”). (C) Median abundances of premature and mature RNAs per gene across 620 RNA-seq data sets for the indicated gene classes. Density scatter plots were fitted with a linear model, whose slope is reported. (D) Heatmaps displaying the classification in terms of post-transcriptional regulation for each gene (row) in each sample (column). k3/k2 ratios were quantified for each gene in each sample and compared with the global trend depicted in C. Each gene is either not expressed (blue), is not differential (white; ratio between the dashed lines in C), or is differentially post-transcriptional regulated (red; ratio above the dashed lines). Above the heatmaps, two color bars indicate the tissue type and disease conditions of each sample. (E) Boxplot of the percentage of genes that are post-transcriptionally regulated for the samples associated to each cell type, color matched with D. (F) Distributions of length, %GC, and free energy for 3′ and 5′ UTRs of genes post-transcriptionally regulated in the brain compared with all genes expressed in the brain (background). (G) Sequence logo of the selected RNA-binding protein motifs in the 3′ UTR regions of brain regulated genes. (H) Frequency and P-values of enrichment for selected motifs of RNA-binding proteins found in UTR regions of brain regulated genes. (I) Hypergeometric P-value for the overlap between the genes associated to the factors in H.

