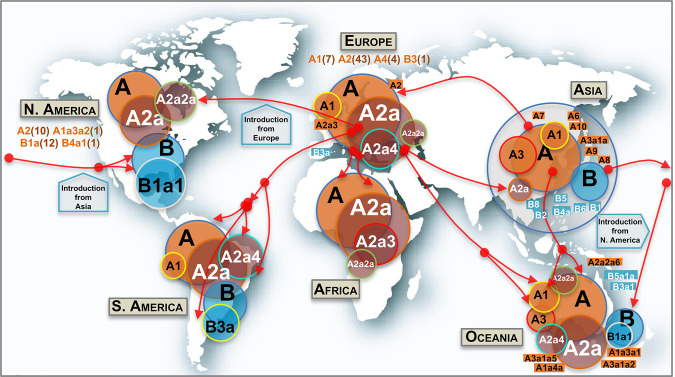
Figure 4.
Map showing the worldwide spread of the main SARS-CoV-2 clades. Circle areas are proportional to frequencies (e.g., A2a is contained within A, and so on), and the arrows indicate just an approximate reconstruction of the phylodynamics of SARS-CoV-2 from the beginning of the Asian outbreak to the non-Asian spread of the pathogen based on the phylogeny, genome chronology (as recorded in the metadata that indicates the sampling origin and dates), and genome variation. Classification of genomes into haplogroups is according to the phylogeny shown in Figure 3. Minor subclades are indicated in rectangular shapes with their corresponding labels. In addition, other minor haplogroups involved in the SARS-CoV-2 spread (in brackets are the number of subclades involved) are indicated below continental labels.

