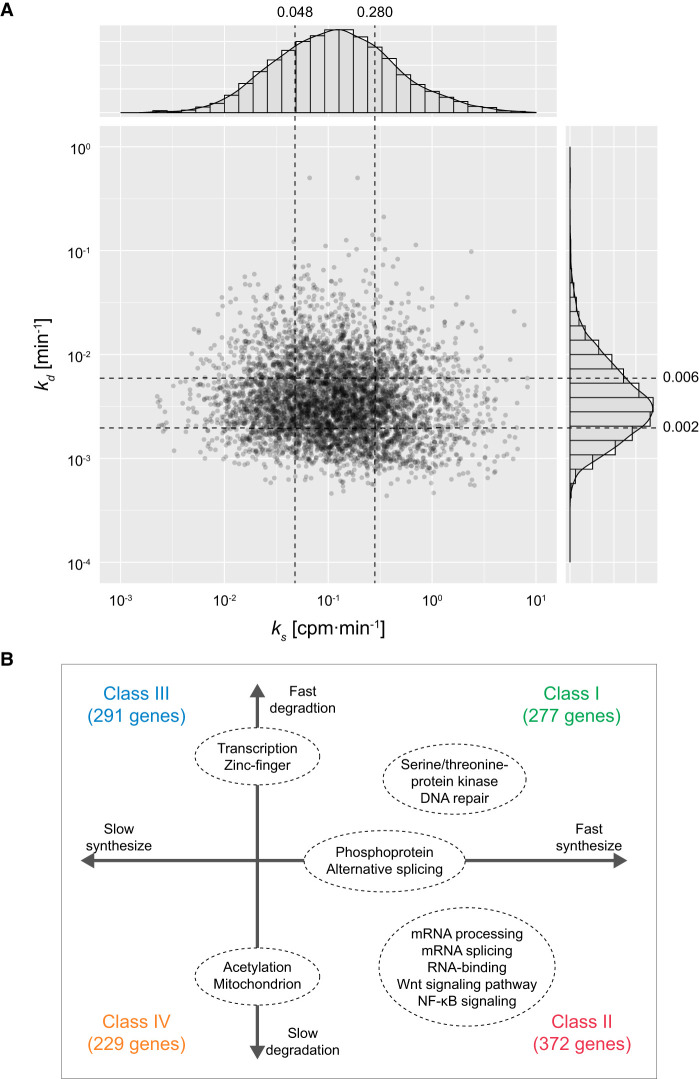
Figure 3.
Joint distribution of RNA synthesis and degradation rates. (A) Joint distribution of RNA synthesis and degradation rates. Histograms of individual rates and a scatter plot are shown. The x- and y-axes indicate RNA synthesis rate (ks) and degradation rate (kd), respectively. The first and third quartiles of RNA synthesis and degradation rates indicated with black dashed lines were adopted as thresholds of the classification. (B) GO enrichment analysis of the genes classified using the RNA synthesis and degradation rates. Only representative terms significantly enriched for each class are shown.

