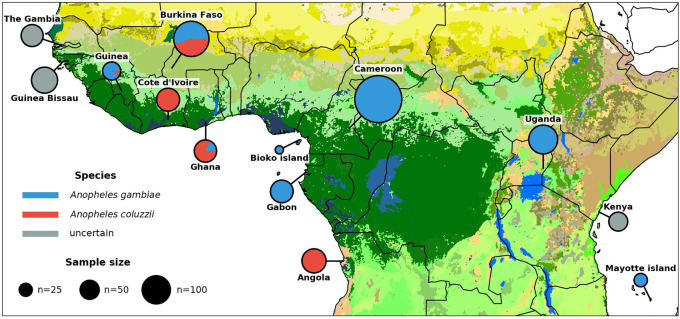
Figure 1.
Ag1000G phase 2 sampling locations. Color of circle denotes species, and area represents sample size. Species assignment is labeled as uncertain for samples from Guinea-Bissau, The Gambia, and Kenya because all individuals from those locations carry a mixture of A. gambiae and A. coluzzii ancestry informative markers (Supplemental Fig. S1). Map colors represent ecosystem classes; dark green designates forest ecosystems. For a compete color legend see Figure 9 in the work of Sayre (2013).

