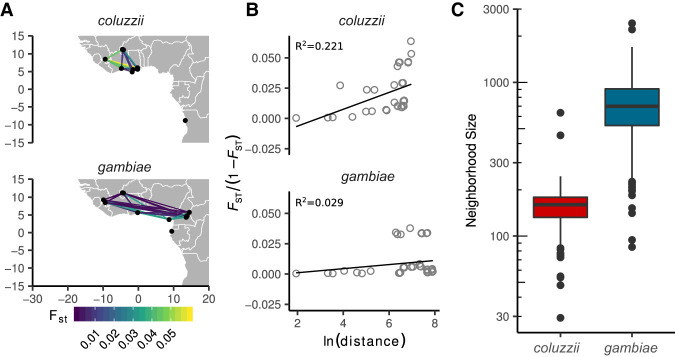
Figure 3.
Comparison of isolation by distance between A. coluzzii and A. gambiae populations from locations in West and Central Africa north of the equatorial rainforest. (A) Study region and pairwise FST. (B) Regressions of average genome-wide FST against geographic distance, following the method of Rousset (1997). Neighborhood size is estimated as the inverse slope of the regression line. Goodness-of-fit is reported as R2. (C) Difference in neighborhood size estimates by species. Box plots show medians and 95% confidence intervals of the distribution of estimates calculated in 200-kbp windows across the euchromatic regions of Chromosome 3.

