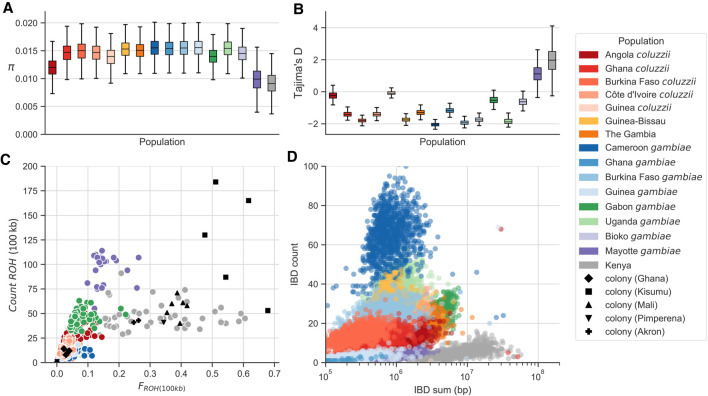
Figure 4.
Genetic diversity within populations. (A) Nucleotide diversity () calculated in nonoverlapping 20-kbp genomic windows using SNPs from euchromatic regions of Chromosome 3. (B) Tajima's D calculated in nonoverlapping 20-kbp genomic windows using SNPs from euchromatic regions of Chromosome 3. (C) Runs of homozygosity (ROH) in individual mosquitoes. Each marker represents an individual mosquito. (D) Runs of identity by descent (IBD) between individuals. Each marker represents a pair of individuals drawn from the same population.

