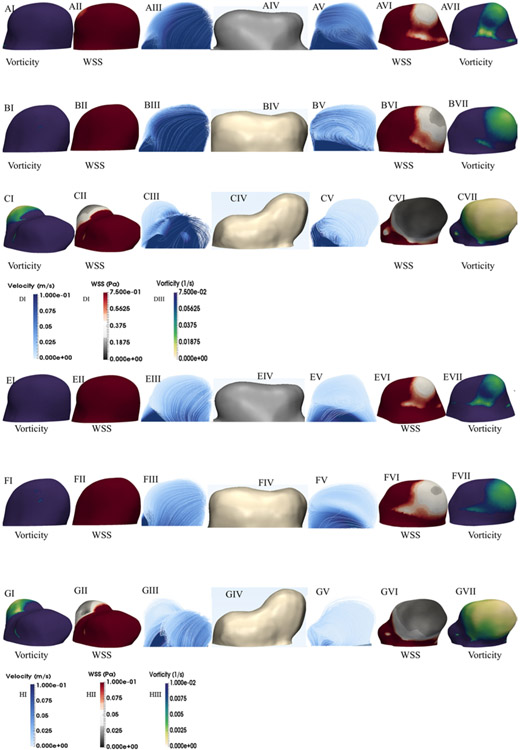
FIG. 4.
A–C: Flow pattern, WSS, and vorticity distribution at systole for the early (A), mid (B), and late (C) stages. The left side demonstrates the nongrowing side of the aneurysm, while the right side corresponds to the growing side of the aneurysm. Note that the first column from left and right show vorticity, the second from left and right show the WSS, and third columns from both directions show the flow pattern. E–G: Flow pattern, WSS, and vorticity distribution at diastole for the early (E), mid (F), and late (G) stages. D and H: Color bars of velocity, WSS, and vorticity at systole and diastole, respectively.

