. 2020 Aug 25;297(2):344–351. doi: 10.1148/radiol.2020200989

Figure 3:

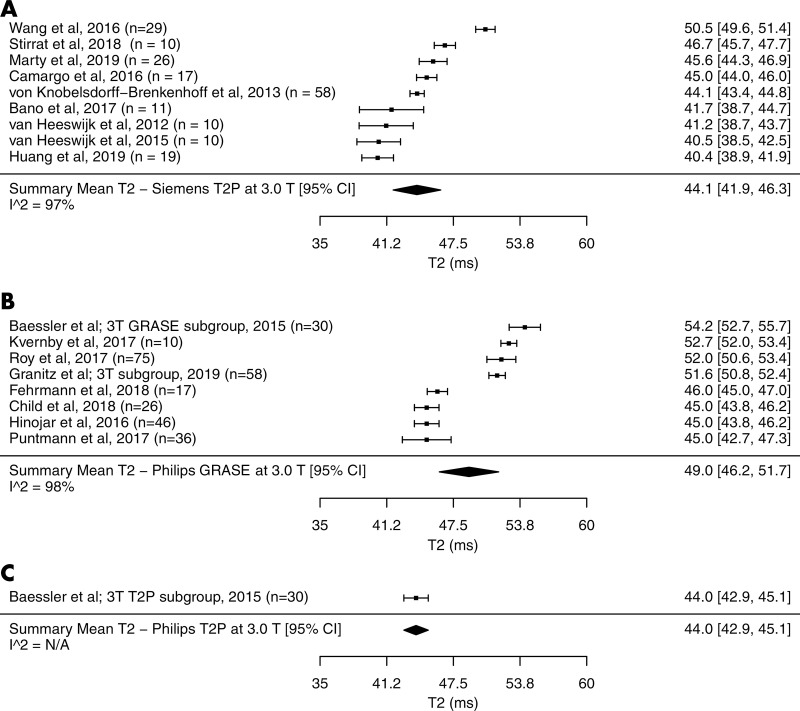
Forest plots of T2 studies show T2 relaxation times at cardiac MRI at 3.0 T in healthy adults. Studies are grouped by vendor and pulse sequences. A, T2 studies performed with a Siemens scanner at 3.0 T using T2-prepared (T2P) sequence, B, T2 studies performed with a Philips scanner at 3.0 T using gradient and spin-echo sequence (GRASE), C, T2 studies performed with a Philips scanner at 3.0 T using T2P sequence. Studies with multiple subgroups are noted by author’s last name, year of publication, and number of patients in each study. CI = confidence interval, N/A = not applicable.

Forest plots of T2 studies show T2 relaxation times at cardiac MRI at 3.0 T in healthy adults. Studies are grouped by vendor and pulse sequences. A, T2 studies performed with a Siemens scanner at 3.0 T using T2-prepared (T2P) sequence, B, T2 studies performed with a Philips scanner at 3.0 T using gradient and spin-echo sequence (GRASE), C, T2 studies performed with a Philips scanner at 3.0 T using T2P sequence. Studies with multiple subgroups are noted by author’s last name, year of publication, and number of patients in each study. CI = confidence interval, N/A = not applicable.