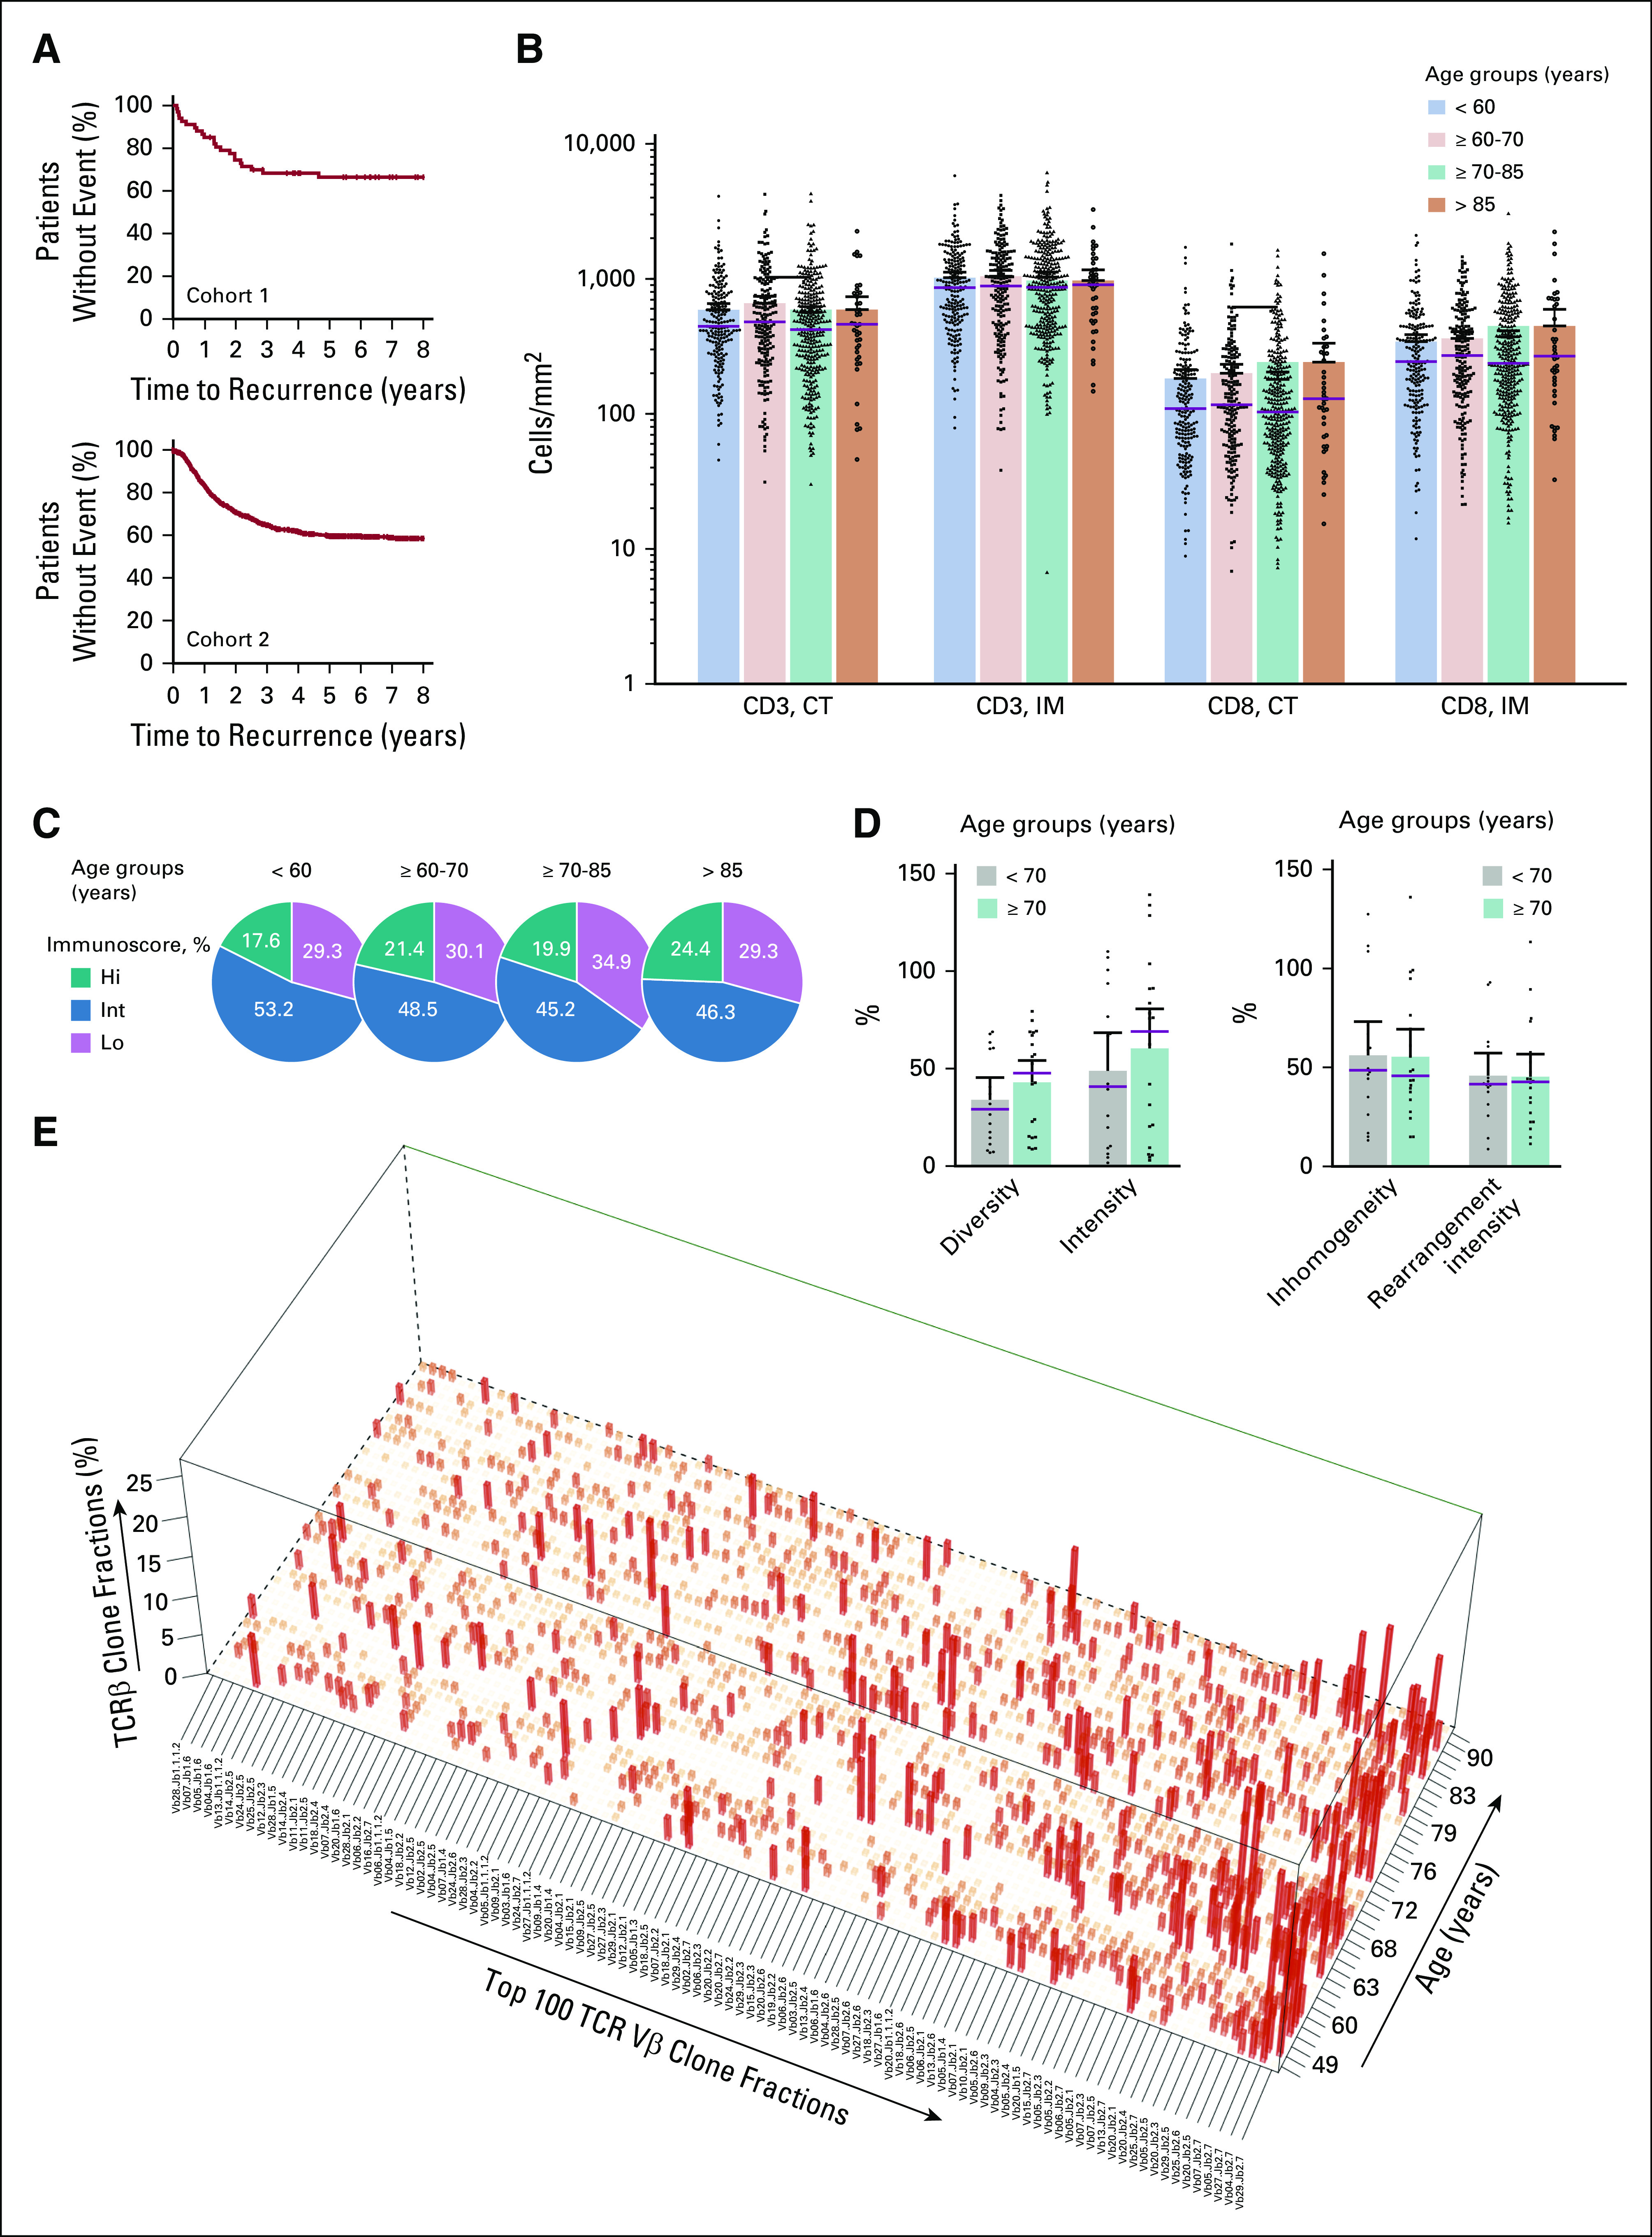
FIG 1.

The immune infiltrate and Immunoscore in patients with different ages. (A) Kaplan-Meier curves for patients with colon cancer from cohorts 1 (upper panel) and 2 (lower panel). (B) Patient groups based on age: < 60 years (light blue), ≥ 60-70 (light orange), ≥ 70-85 (green) and ≥ 85 (orange)and CD3 and CD8 immune densities quantified in the tumor core (CT) and invasive margin (IM). Each dot represents a mean whole-slide quantification in 1 patient. (C) The Society for Immunotherapy of Cancer study cutoff of the Immunoscore scoring system applied to convert immune densities into percentiles. The Immunoscore classified patients (grouped by age) into three categories: low (Lo, mean percentile 0%-25%, purple), intermediate (Int, > 25%-70%, blue), and high (Hi, > 70%-100%, green). (D) T-cell receptor diversity, intensity, inhomogeneity, and rearrangement intensity in patient groups based on age (< 70, gray; ≥ 70, green). (E) Clonal configuration of T-cell receptor (TCR) transcripts (quantitative polymerase chain reaction) in patients with different ages. The top 100 most frequent clones are shown in descending order (mean percentage over all patients). Each bar represents an individual clonotype.
