
FIG 5.
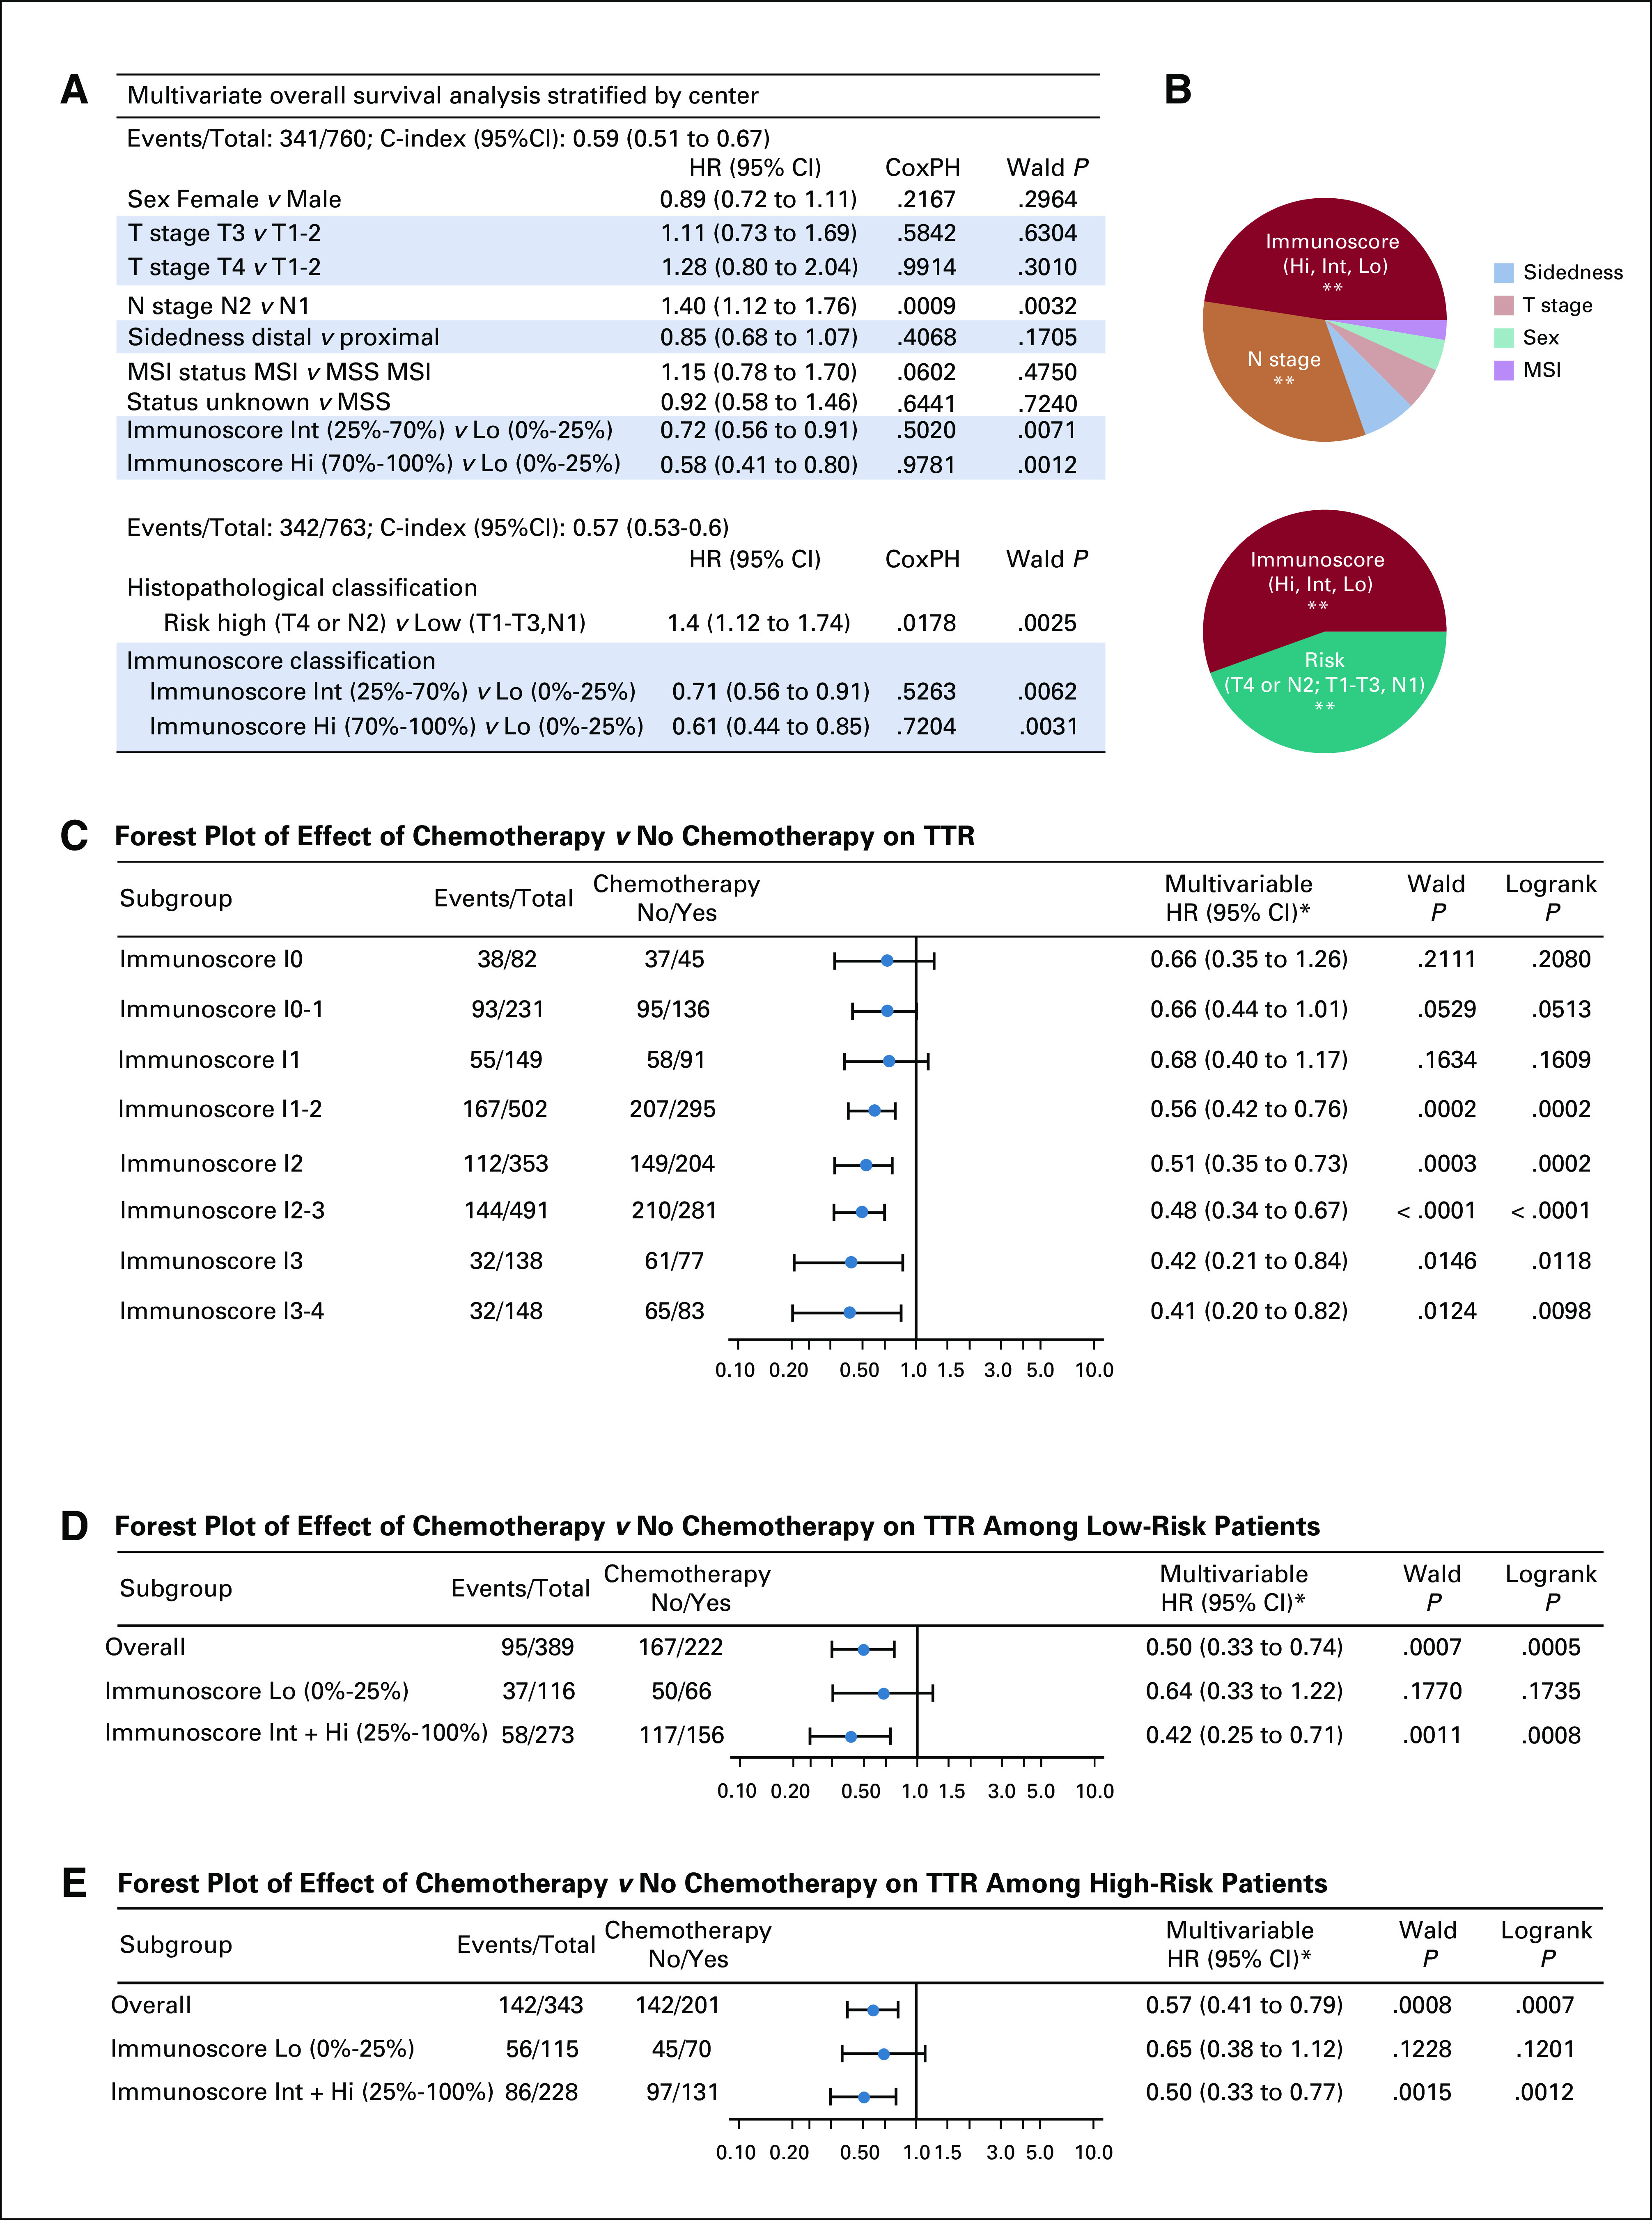
Clinical performance of tumor- and immune-related risk parameters and predictive value. (A) Cox multivariable regression analysis of overall survival combining the three-category Immunoscore: low (Lo, 0%-25%), Intermediate (Int, > 25%-70%), and high (Hi, > 70%-100%) with clinical parameters: sex, T stage, N stage, sidedness, and microsatellite instability (MSI) status. (B) Relative importance of each risk parameter to survival risk for overall survival using the χ2 proportion test for clinical parameters and Immunoscore. Significant prediction of survival using likelihood ratio test. Forest plots representing the predictive value of response to chemotherapy (time to recurrence [TTR]) in (C) Immunoscore groups: I0 (0%-10%), I0-1, I1(> 10%-25%), I1-2, I2 (> 25%-70%), I2-3, I3, (> 70%-95%), and I3-4( > 95%-100%), (D) Immunoscore Lo and Int + Hi, and (D) among high-risk (T4 or N2) and (E) low-risk (T1-T3 and N1) patient subgroups. (*) Subgroup analysis for postoperative chemotherapy with No Chemotherapy as reference. (**): Significant multivariable Wald P value < .01. CoxPH, Cox proportional hazards test P value; HR, hazard ratio, MSS, microsatellite stable.