Figure 5.
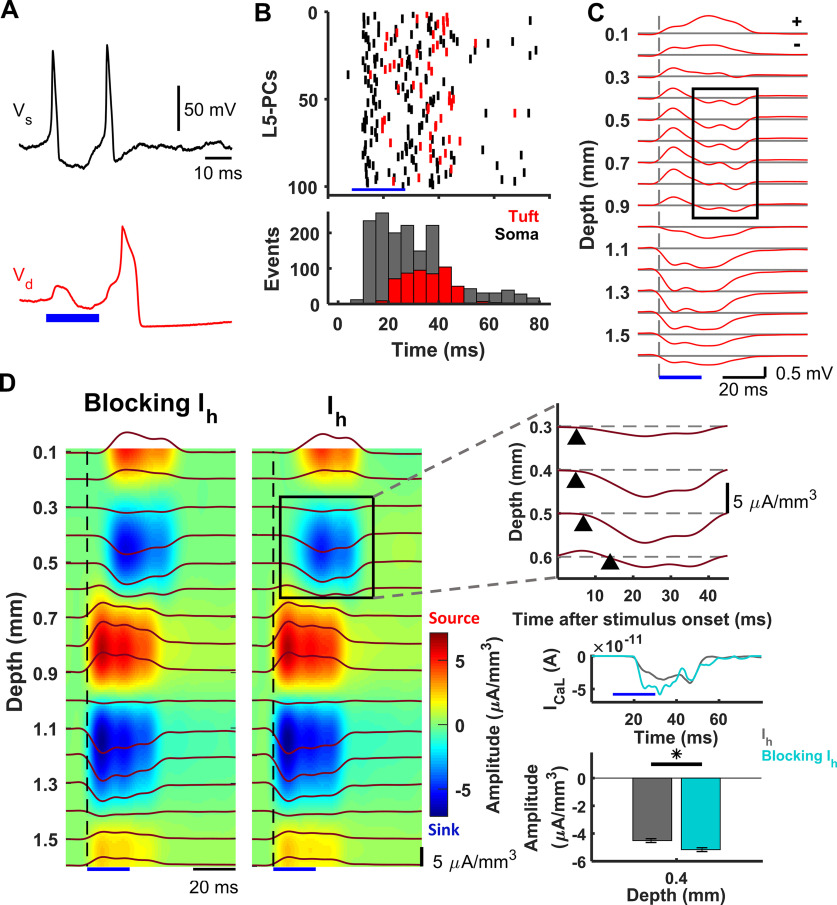
LFP and CSD derived from dendritic Ca2+ spikes in a collection of L5-PCs. A, Basal-dendritic/somatic (black, Vs) and apical-dendritic/trunk (red, Vd) simulated responses of a collection of 1000 L5-PCs to suprathreshold somatic stimulation above the CF. B, Raster plots (top) and poststimulus time histogram (bottom) of 100 randomly selected L5-PCs (top) showing spike times of Na+-APs (black) and Ca2+ spikes (red). The total number of Na+-AP and Ca2+ spike events every 5 ms is shown (bar plots, bottom). C, LFPs evoked by supra-CF stimulation of the collection of L5-PCs calculated on an array of 16 microelectrodes (100 µm separation). Voltage traces at each depth are averaged over 10 simulated trials, each randomly affected by system noises in the membrane potentials and the calcium concentrations. Black rectangle represents the delayed sink associated with the dendritic Ca2+ spike. The symbols '+' and '−' in the top-right corner of the panel indicate positive and negative potentials relative to the horizontal gray lines, respectively. D, CSD analysis of the evoked LFPs averaged over 10 trials without (left) and with (right) the Ih current. Blue represents sinks. Red represents sources. Top right, Expansion of the selected area to reveal the delayed sink associated with the Ca2+ spikes arising earliest 0.4 mm below the pia matter. Middle right, Plots averaged current in the trunk of the L5-PCs, showing an amplitude increase ∼15-25 ms after stimulation when Ih was absent. Bottom right, Comparison of the average with SEM of the amplitude of this current sink with and without the Ih current, which was significantly different (p = 0.002, Wilcoxon signed-rank test, N = 10 trials). *p < 0.05. Blue bar in all the plots represents the time window for the supra-CF stimulation.

