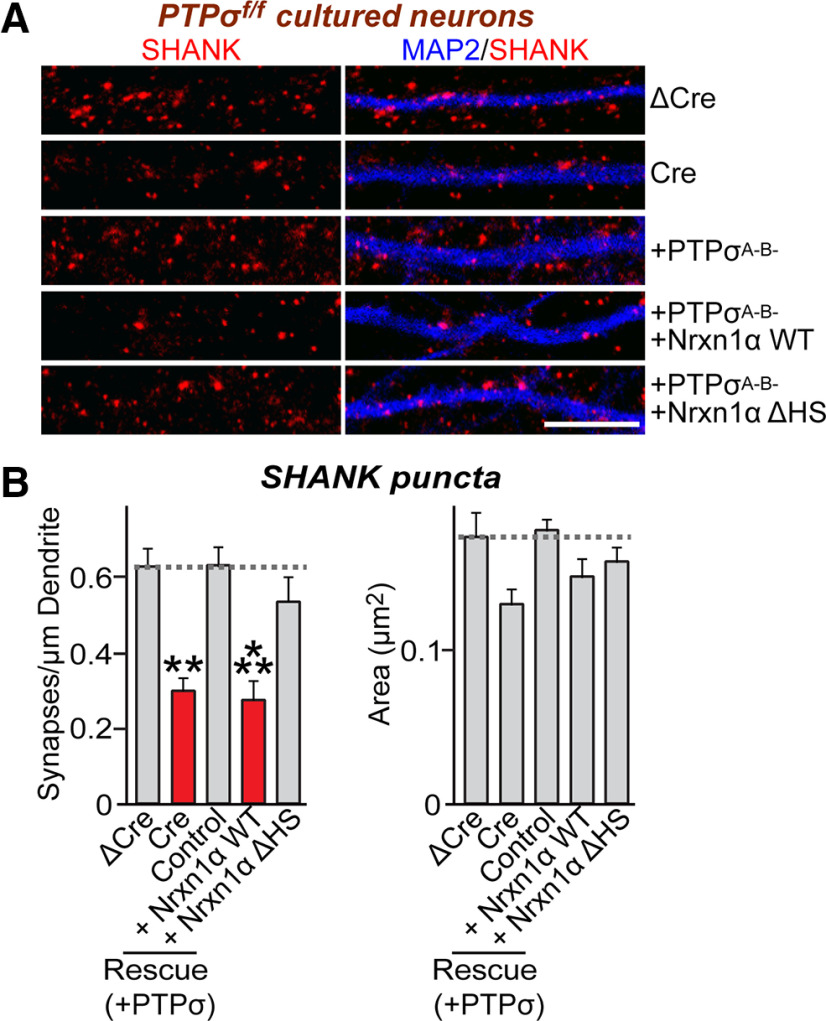
Figure 13.
Nrxn1α negatively regulates the excitatory postsynapse development activity of PTPσ. A, Representative images from PTPσ floxed cultured hippocampal neurons infected with lentiviruses expressing ΔCre or Cre, or coinfected with lentiviruses expressing Cre and the indicated overexpression viruses at DIV4 and captured by double-immunofluorescence detection of MAP2 (blue) and the excitatory postsynaptic marker SHANK (red) at DIV14. Scale bar: all images, 10 μm. B, Summary graphs showing SHANK puncta density (left) and SHANK puncta size (right) from A. Two or three dendrites per transfected neuron were analyzed and group-averaged. Data are mean ± SEM. **p < 0.01; ***p < 0.001; ANOVA with a nonparametric Kruskal–Wallis test. ΔCre, n = 16; Cre, n = 14; + PTPσA–B–, n = 18; + PTPσA–B– + Nrxn1α WT, n = 19; and + PTPσA–B– + Nrxn1α ΔHS, n = 15. p values for individual comparisons of puncta density are as follows: ΔCre versus Cre, p = 0.0050; ΔCre versus + PTPσA–B–, p > 0.9999; ΔCre versus + PTPσA–B– + Nrxn1α WT, p = 0.0001; and ΔCre versus + PTPσA–B– + Nrxn1α ΔHS, p > 0.9999. p values for individual comparisons of puncta size are as follows: ΔCre versus Cre, p > 0.9999; ΔCre versus + PTPσA–B–, p = 0.1013; ΔCre versus + PTPσA–B– + Nrxn1α WT, p > 0.9999; and ΔCre versus + PTPσA–B– + Nrxn1α ΔHS, p = 0.3734.

