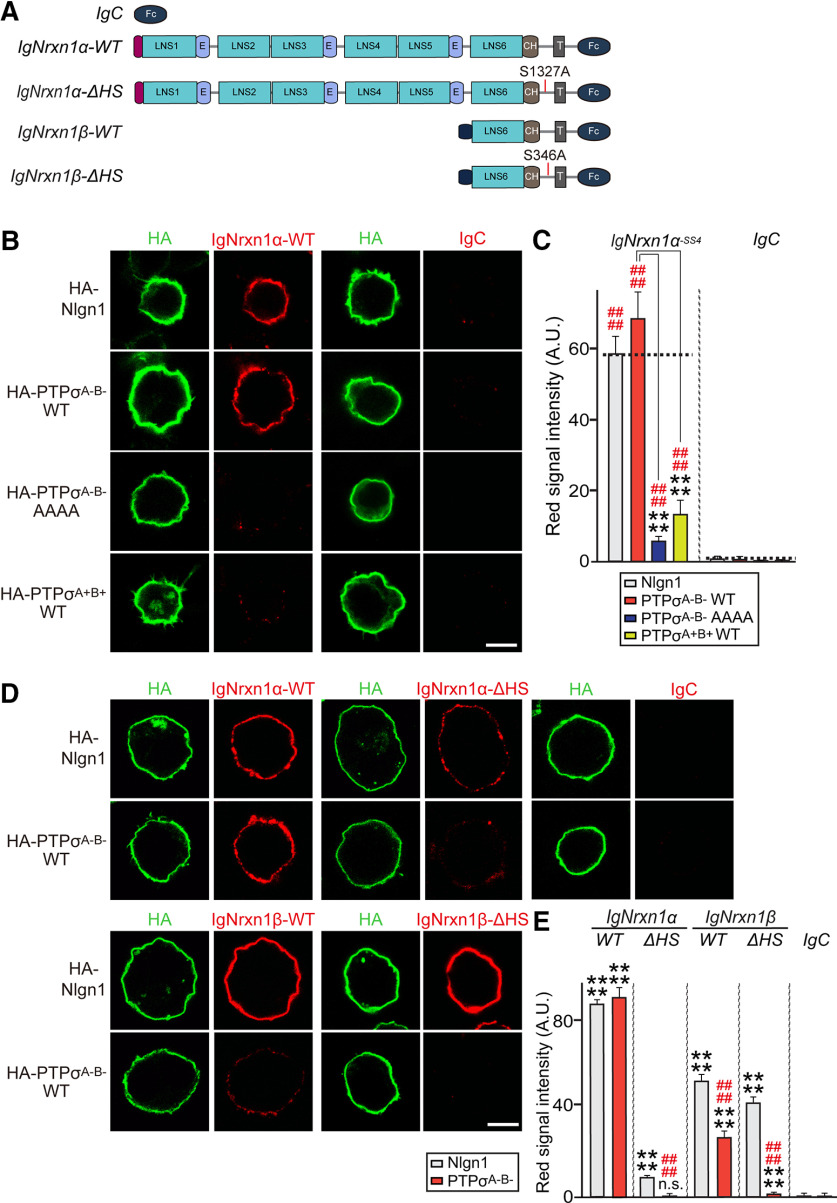
Figure 9.
Interaction of PTPσ with Nrxn1 depends on HS moieties attached to both proteins. A, Schematic depiction of Nrxn1 WT and ΔHS mutants. B, Representative images of cell-surface binding assays. HEK293T cells expressing HA-tagged Nlgn1, PTPσ WT, or PTPσ AAAA mutant were incubated with 10 μg/ml of control IgC or Ig-Nrxn1α-SS4, and then analyzed by immunofluorescence imaging of Ig-fusion proteins (red) and HA antibodies (green). Scale bar, 10 μm. C, Quantification of average red intensity in the green-positive region of HEK293T cells in B. Data are mean ± SEM. ****p < 0.0001; ####p < 0.0001; Mann–Whitney U test or ANOVA with a nonparametric Kruskal–Wallis test. n indicates the number of cells as follows: Ig-Nrxn1α/Nlgn1, n = 25; Ig-Nrxn1α/PTPσA–B– WT, n = 25; Ig-Nrxn1α/PTPσA–B– AAAA, n = 16; Ig-Nrxn1α/PTPσA+B+ WT, n = 20; IgC/Nlgn1, n = 14; IgC/PTPσA–B– WT, n = 14; IgC/PTPσA–B– AAAA, n = 16; and IgC/PTPσA+B+ WT, n = 14. p values for individual comparisons are as follows: IgC versus Ig-Nrxn1α/Nlgn1, p < 0.0001; IgC versus Ig-Nrxn1α/PTPσA–B– WT, p < 0.0001; IgC versus Ig-Nrxn1α/PTPσA–B– AAAA, p < 0.0001; IgC versus Ig-Nrxn1α/PTPσA+B+ WT, p < 0.0001. p values for PTPσA–B– WT: Ig-Nrxn1α/PTPσA–B– WT versus PTPσA–B– AAAA, p < 0.0001; and Ig-Nrxn1α/PTPσA–B– WT versus PTPσA+B+ WT, p < 0.0001. D, Representative images of cell-surface binding assays. HEK293T cells expressing HA-Nlgn1 or HA-PTPσ were incubated with 10 μg/ml of control IgC, Ig-Nrxn1α-SS4 WT, Ig-Nrxn1α-SS4ΔHS, Ig-Nrxn1β-SS4 WT, or Ig-Nrxn1β-SS4ΔHS, and then analyzed by immunofluorescence imaging of Ig-fusion proteins (red) and HA antibodies (green). Scale bar, 10 μm. E, Quantification of the average red intensities in green-positive regions of HEK293T cells in D. Data are mean ± SEM. ****p < 0.0001; ####p < 0.0001; Mann–Whitney U test. n indicates the number of cells as follows: Ig-Nrxn1α/Nlgn1, n = 28; Ig-Nrxn1α/PTPσ, n = 26; Ig-Nrxn1α ΔHS/Nlgn1, n = 24; Ig-Nrxn1α ΔHS/PTPσ, n = 34; Ig-Nrxn1β/Nlgn1, n = 21; Ig-Nrxn1β/PTPσ, n = 28; Ig-Nrxn1βΔHS/Nlgn1, n = 20; Ig-Nrxn1βΔHS/PTPσ, n = 22; IgC/Nlgn1, n = 19; and IgC/PTPσ, n = 18. p values for individual comparisons are as follows: IgC versus Ig-Nrxn1α/Nlgn1, p < 0.0001; IgC versus Ig-Nrxn1α/PTPσ, p < 0.0001; IgC versus Ig-Nrxn1α ΔHS/Nlgn1, p < 0.0001; IgC versus Ig-Nrxn1α ΔHS/PTPσ, p = 0.1632; IgC versus Ig-Nrxn1β/Nlgn1, p < 0.0001; IgC versus Ig-Nrxn1β/PTPσ, p < 0.0001; IgC versus Ig-Nrxn1βΔHS/Nlgn1, p < 0.0001; IgC versus Ig-Nrxn1βΔHS/PTPσ, p < 0.0001; Ig-Nrxn1α versus Ig-Nrxn1α ΔHS/PTPσ, p < 0.0001; Ig-Nrxn1α versus Ig-Nrxn1β/PTPσ, p < 0.0001; and Ig-Nrxn1α versus Ig-Nrxn1βΔHS/PTPσ, p < 0.0001.

