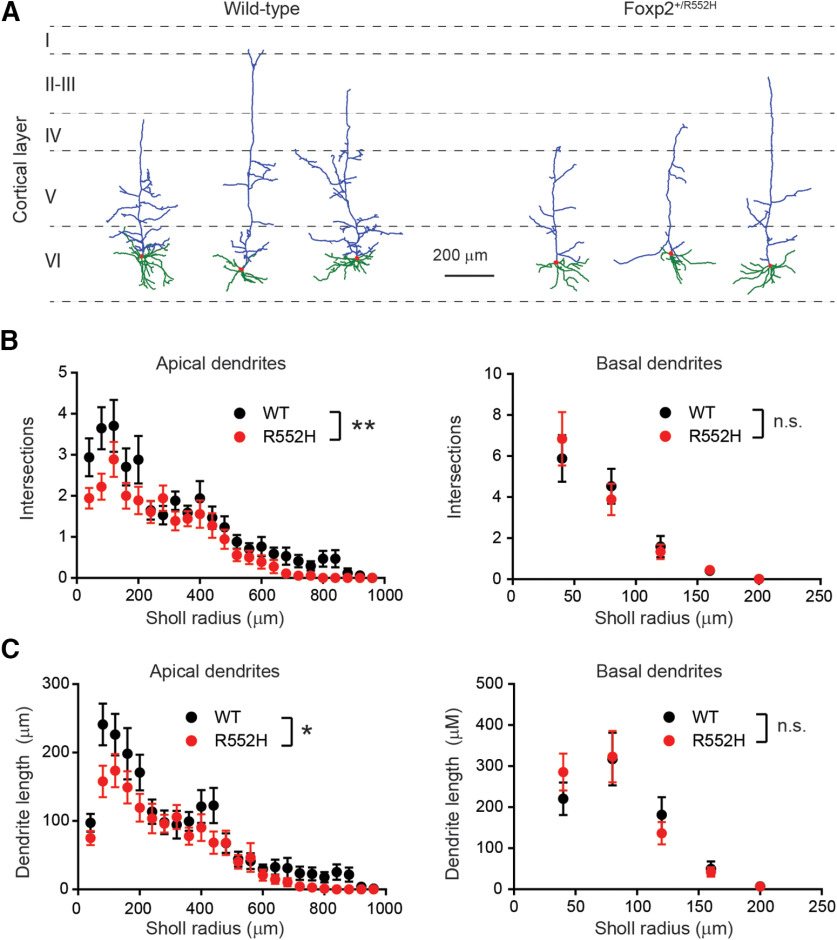
Figure 2.
Sholl analysis demonstrating decreased apical dendrite arborization of Foxp2+/R552H cortical neurons. A, Representative examples of the dendritic trees of control and Foxp2+/R552H neurons. The apical dendrite is in blue, basal dendrites are in green. B, C, Sholl analysis of auditory cortex neurons showing less complex dendritic arbor (B) and decreased length of apical dendrite branches (C) in Foxp2+/R552H neurons; **two-way RM ANOVA, genotype effect, F(1,33) = 7.87, p = 0.0084, basal dendrite intersections: F(1,33) = 0.00072, p = 0.98, apical dendrite length: *F(1,33) = 4.79, p = 0.036, basal dendrite length: F(1,33) = 0.0091, p = 0.92; WT: n = 17 cells from 5 mice; Foxp2+/R552H: n = 18 cells from 4 mice. Data are represented as mean ± SEM; *p < 0.05, **p < 0.01. n.s., not significant.

