Figure 3.
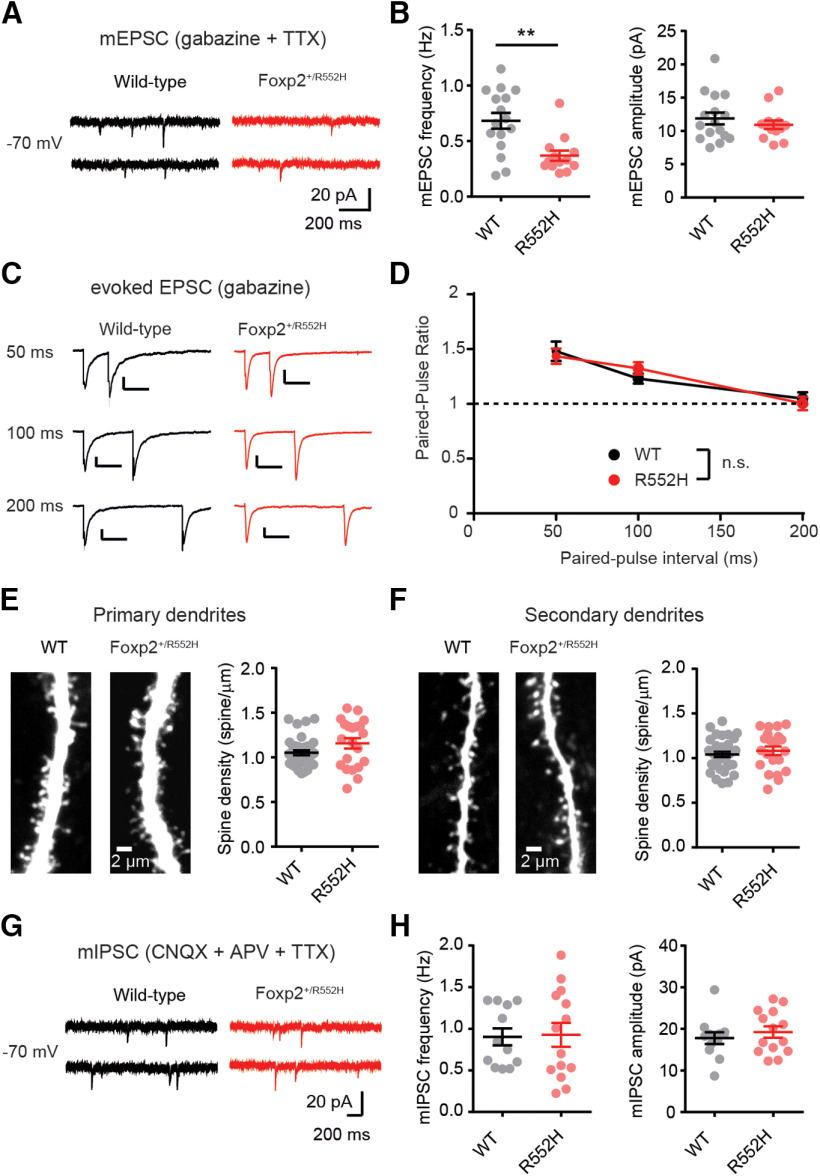
Decrease in excitatory, but not inhibitory synaptic transmission in Foxp2+/R552H cortical neurons. A, Sample traces of mEPSCs from WT and Foxp2+/R552H cells recorded at −70 mV in the presence of TTX and GABAzine. B, Mean mEPSC frequency and amplitude in control and Foxp2+/R552H neurons (frequency: **Mann–Whitney test, p = 0.0026; amplitude: t test, p = 0.42, WT: n = 16 cells from 4 mice; Foxp2+/R552H: n = 13 cells from 3 mice). C, Average traces of EPSCs evoked by paired-pulse stimulation with 50-, 100-, and 200-ms interpulse intervals, recorded from a control neuron (left traces) and a Foxp2+/R552H neuron (right traces). D, Unchanged PPR for interpulse intervals of 50, 100, and 200 ms, indicating an absence of presynaptic release alterations in Foxp2+/R552H neurons. WT: n = 20 cells from 3 mice; Foxp2+/R552H: n = 18 cells from 3 mice; two-way RM ANOVA, genotype effect, F(1,36) = 0.00021, p = 0.99. n.s., not significant. E, Maximal intensity projections of 3D confocal stacks showing spines in primary apical dendrites from a WT and a Foxp2+/R552H neuron (left), and spine density histogram (right; WT: n = 36 cells from 8 mice; Foxp2+/R552H: n = 21 cells from 5 mice). F, Same as in E, for secondary apical dendrites. G, Example traces of mIPSCs from each genotype recorded at −70 mV in the presence of TTX, APV and CNQX using a high chloride intracellular solution. H, Mean mIPSC frequency and amplitude in WT (n = 12 cells from 3 mice) and Foxp2+/R552H cells (n = 14 cells from 4 mice); frequency: Mann–Whitney test, p = 0.66, amplitude: t test, p = 0.47. Throughout, data are represented as mean ± SEM.

