Figure 4.
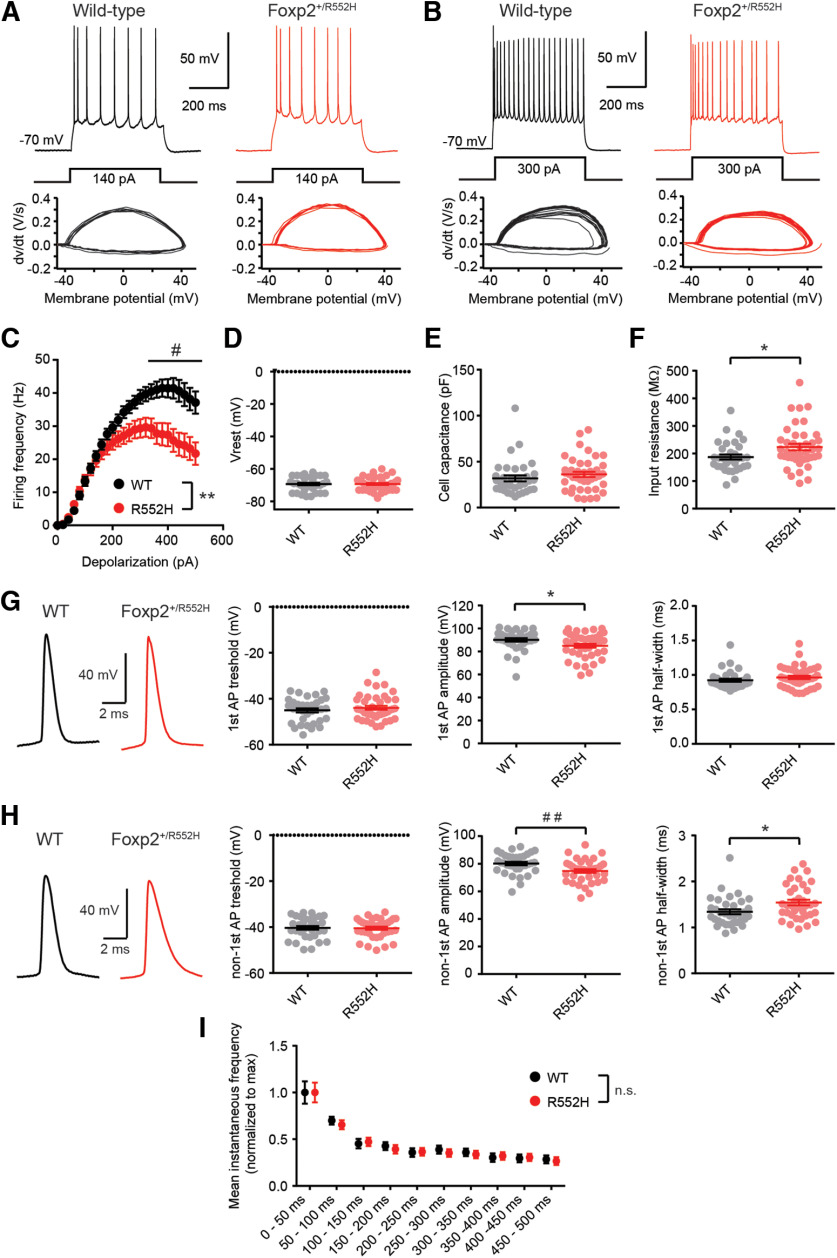
Decreased intrinsic excitability in Foxp2+/R552H cortical neurons. A, Sample spike trains evoked by a 140-pA somatic current injection in a WT (left) and a Foxp2+/R552H neuron (right). B, Same as in A for a 300-pA current injection. C, mean f-i curve for control (n = 34 cells from 9 mice) and Foxp2+/R552H neurons (n = 41 cells from 9 mice); **two-way RM ANOVA, genotype effect, F(1,73) = 7.56, p = 0.0075; #p < 0.05, Sidak's post hoc test. D–F, Vrest, cell capacitance (Cm), and Rinput in control and Foxp2+/R552H neurons. Bars represent the mean ± SEM; full circles show individual recordings; *Mann–Whitney test, p = 0.013. G, Representative examples of the first AP of a spike train (left) and AP parameters in WT and Foxp2+/R552H neurons (right); *Mann–Whitney test, p = 0.024; ##t test, p = 0.005. H, Same as in G for non-first APs (i.e., all APs in the spike train except the first one); *Mann–Whitney test, p = 0.012. I, Mean instantaneous spiking frequency per bin of 50 ms (500-ms depolarizing step), normalized to the maximal mean instantaneous frequency for each genotype. Spike frequency adaptation was unchanged (WT: n = 34 cells from 9 mice, Foxp2+/R552H: n = 38 cells from 9 mice; two-way RM ANOVA, genotype effect, F(1,70) = 0.028, p = 0.87). n.s., not significant.

