Figure 3.
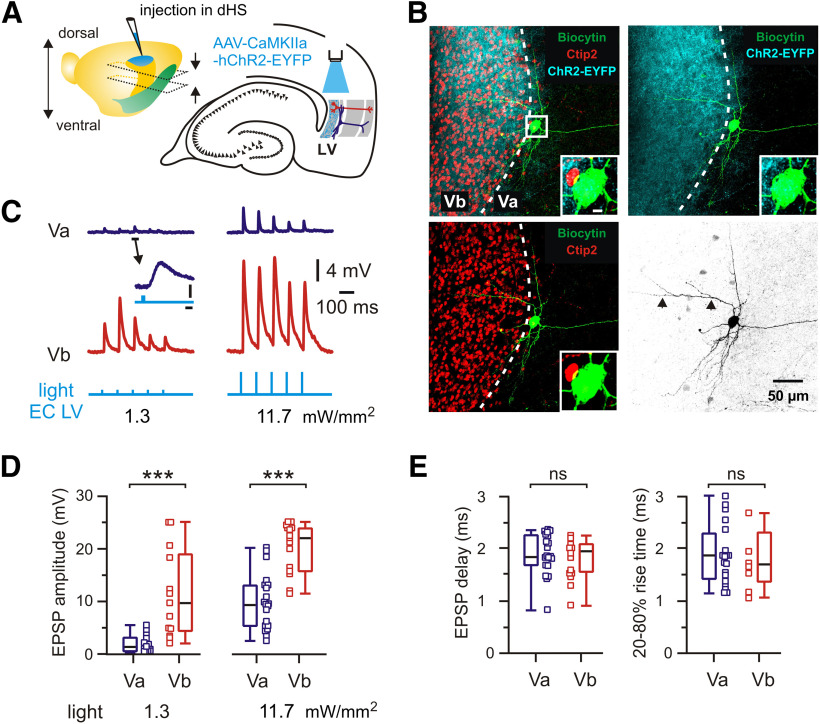
Functional connectivity between dorsal hippocampus and mEC LVa and LVb excitatory neurons. A, Left, Brain hemisphere with indication of the injection site in the dorsal hippocampus (dHS). Approximate positions of horizontal sections used in experiments are indicated by arrows. Note the more dorsal location of slices. Right, Schematic representation of horizontal hippocampal–EC slice with position of light stimulation to activate axons from dorsal hippocampal neurons infected with AAV-CaMKIIa-hChR2-EYFP. B, z-Projected confocal images of a biocytin-filled mEC LVa neuron overlaid with Ctip2 immunolabeling and fluorescent staining of hippocampal axons expressing hChR2-EYFP. Dotted line indicates the approximate border between LVb and LVa. Note the strong fluorescence of axonal fibers in Ctip2-positive LVb and weak but recognizable fluorescence around the Ctip2-negative LVa neuron. Insets, Higher magnification of the soma indicated by boxed area. Scale bar, 5 µm. Right bottom image shows the same neuron in black and white contrast. A dendritic branch extending within LVb is indicated by arrowheads. C, Light-evoked EPSPs recorded from LVa and LVb neurons. Example traces of synaptic responses corresponding to two different stimulation intensities. Note that low-intensity light pulses do trigger clearly discernible synaptic responses in the LVa neuron. The marked event is shown at expanded scale. Calibration: 2 ms, 0.5 mV. Blue light pulses, 1 ms. D, Box plots of EPSP amplitude induced by light pulses with two different stimulation intensities. E, Box plots of EPSP time delay and EPSP 20–80% rise time. Data obtained from recordings with 11.7 mW/mm2 light pulse intensity. All data are presented as the median (P25; P75). Whiskers show minimum and maximum values. Squares represent individual values. Mann–Whitney test: ***p < 0.001; ns, not significant.

