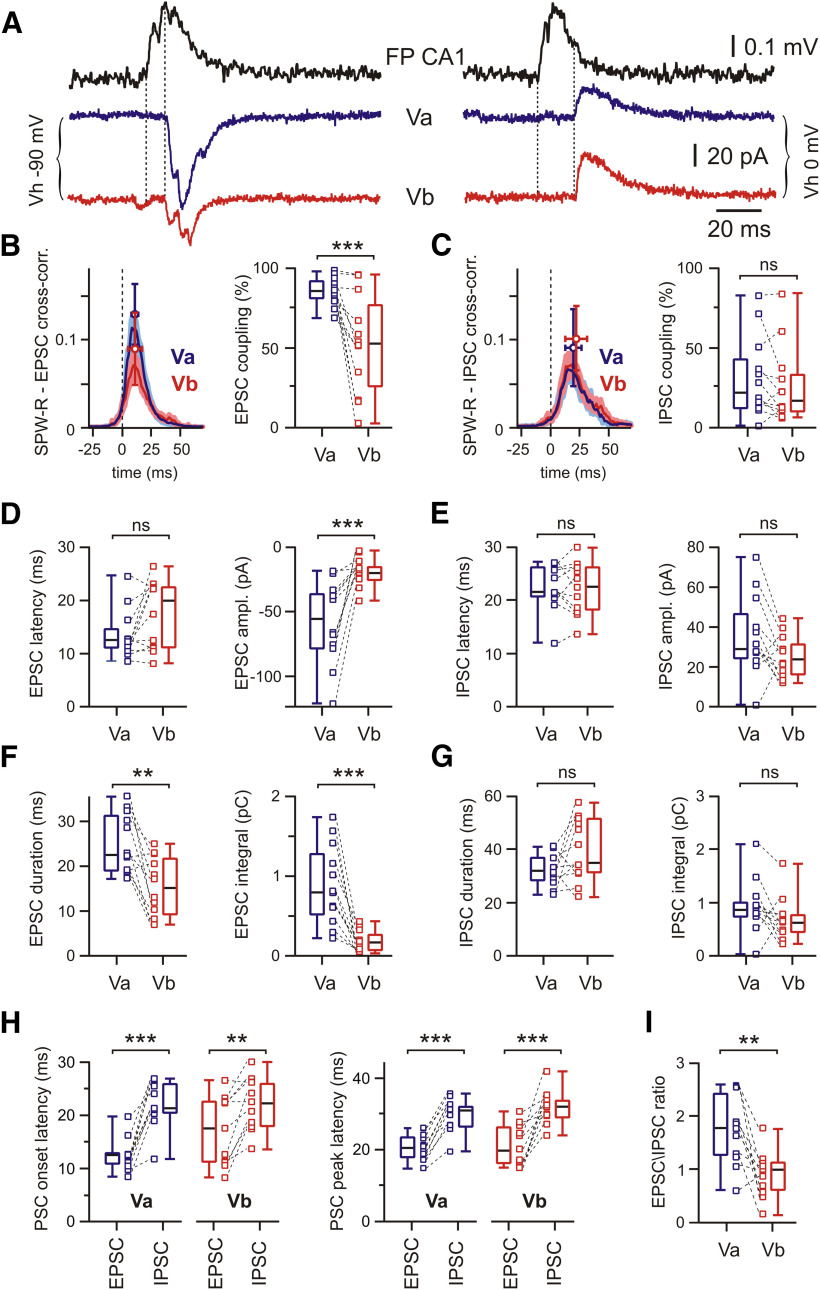
Figure 7.
Postsynaptic currents in mEC LVa and LVb neurons during SPW-R activity. A, Raw traces of SPW-Rs recorded in CA1 and associated PSCs recorded from mEC LVa and LVb neurons at two different holding potentials highlighting putative EPSCs (left) and IPSCs (right). Dotted lines indicate PSC latency. B, Averaged cross-correlograms between SPW-Rs and EPSCs in LVa (blue) and LVb (red) neurons (peak values: mean ± SD; left). Box plots show higher EPSC coupling to SPW-Rs for LVa compared with LVb neurons (right). C, Same analysis as in B for IPSCs. No difference between LVa and LVb neurons for inhibitory coupling to SPW-Rs. D, Box plots of EPSC latency and amplitude for LVa and LVb neurons. E, Latency and amplitude of IPSCs. F, Box plots of EPSC duration and charge transfer (current integral) for LVa and LVb neurons. Note the stronger input to LVa neurons compared with LVb neurons. G, Same as in F for IPSCs. H, Latency of PSC onset (left) and peak (right) for both cell populations and response directions. IPSC latency is significantly longer than EPSC latency for both types of excitatory LV neurons. I, EPSC/IPSC amplitude ratios. Note the stronger net excitation of LVa versus LVb neurons. Data are presented as the median (P25; P75) and individual values. Whiskers show minimum and maximum values. Wilcoxon test: **p < 0.01; ***p < 0.001; ns, not significant.

