Figure 1.
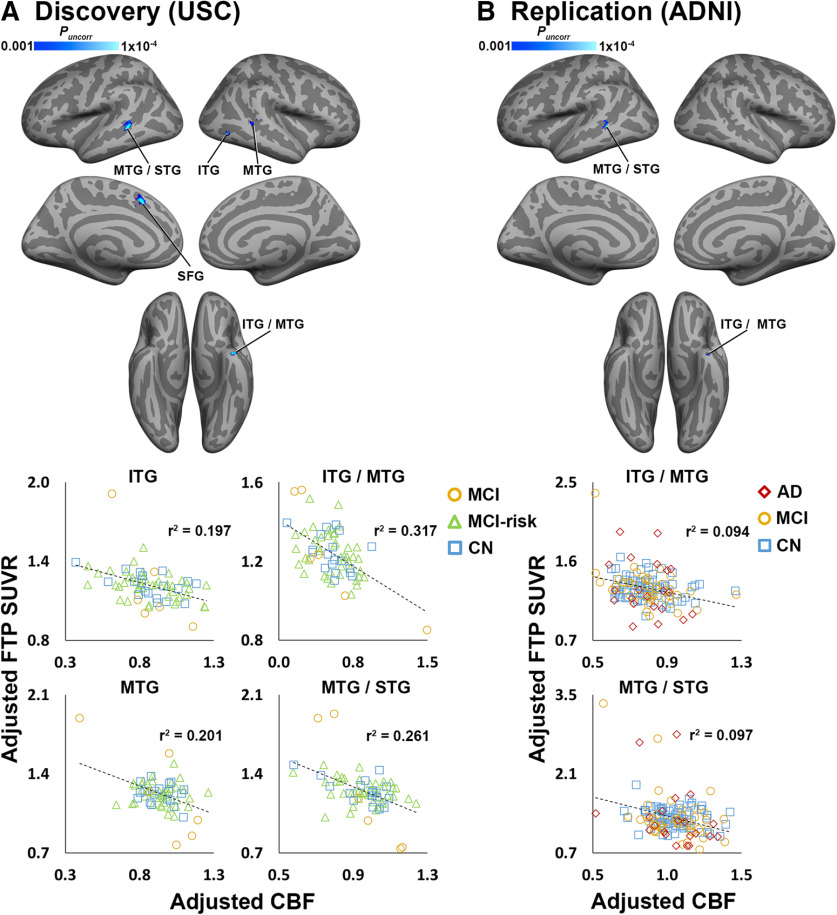
CBF and tau are negatively correlated in discovery and replication analyses. A, Clusters shown in blue color scale depict significant negative correlations between CBF (normalized by global gray matter CBF) and FTP SUVR in the discovery cohort (n = 68). B, Blue clusters show significant CBF–tau correlations in the ADNI replication cohort (n = 138), masked with significant results from the discovery analysis (A). All analyses were covaried for age, sex, diagnosis, and amyloid CL. CL calibration is shown in Extended Data Figures 1-1 and 1-2. For visualization purposes, average values from selected significant clusters were extracted, adjusted for covariates, and plotted below each analysis. Coordinates and statistics for all significant clusters are listed in Extended Data Figure 1-3. Note: because the voxelwise statistical threshold was set at p < 0.001, the p value for each of the plots is <0.001.

