Figure 4.
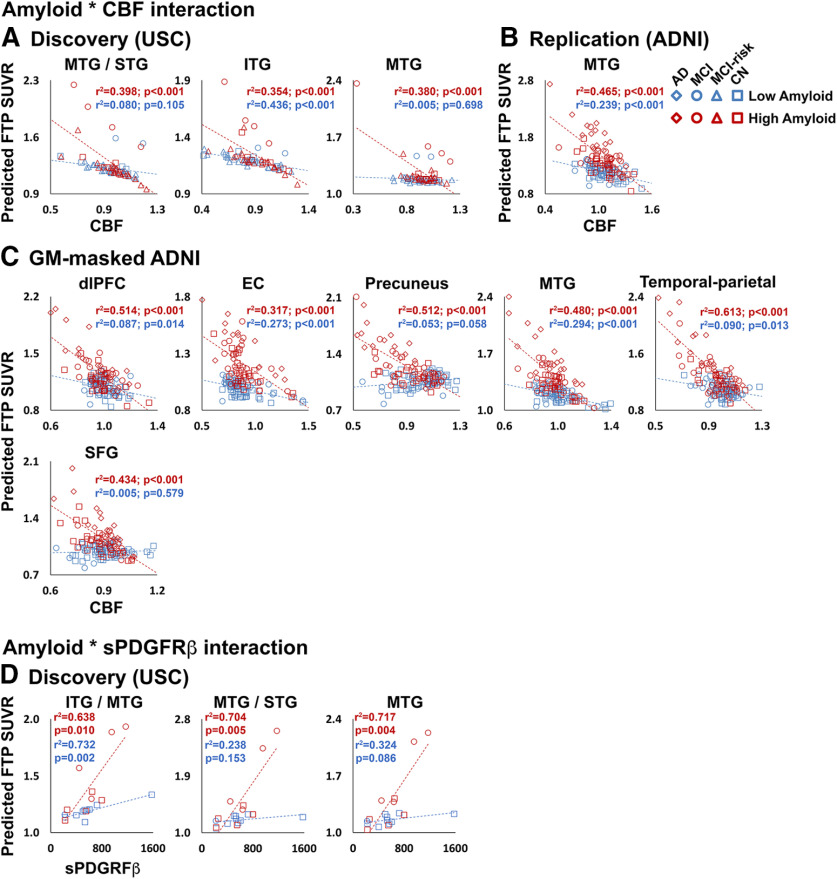
Participants with high amyloid burden show stronger relationships between CBF and sPDGFRβ. A–C, Amyloid * CBF interaction effects on FTP SUVR in discovery (A), replication (B), and secondary GM-masked ADNI (C) analyses. D, Amyloid * sPDGFRβ interaction effects on FTP SUVR from discovery analysis ROIs. Average CBF and FTP SUVR from significant clusters in the voxelwise analysis, or CSF sPDGFRβ, were entered into GLMs. Predicted FTP SUVR from the models is plotted against regional CBF (normalized by global gray matter CBF) or sPDGFRβ (D). All analyses were covaried for age, sex, diagnosis, gray matter volume, and amyloid CL. Amyloid CL was entered as a continuous variable in the model, but for visualization purposes a median split was used to group participants into a low-amyloid group (shown in blue) and a high-amyloid group (shown in red). Detailed statistics for all amyloid * CBF/sPDGFRβ interaction terms are listed in Extended Data Figure 4-1. Plots for AD-MCI and CN subgroups of the ADNI replication cohort are displayed in Extended Data Figure 4-2. Note: the p values shown on the scatterplots is for display purposes only and is not a statistical result from the primary GLM analyses including amyloid CL as a continuous variable.

