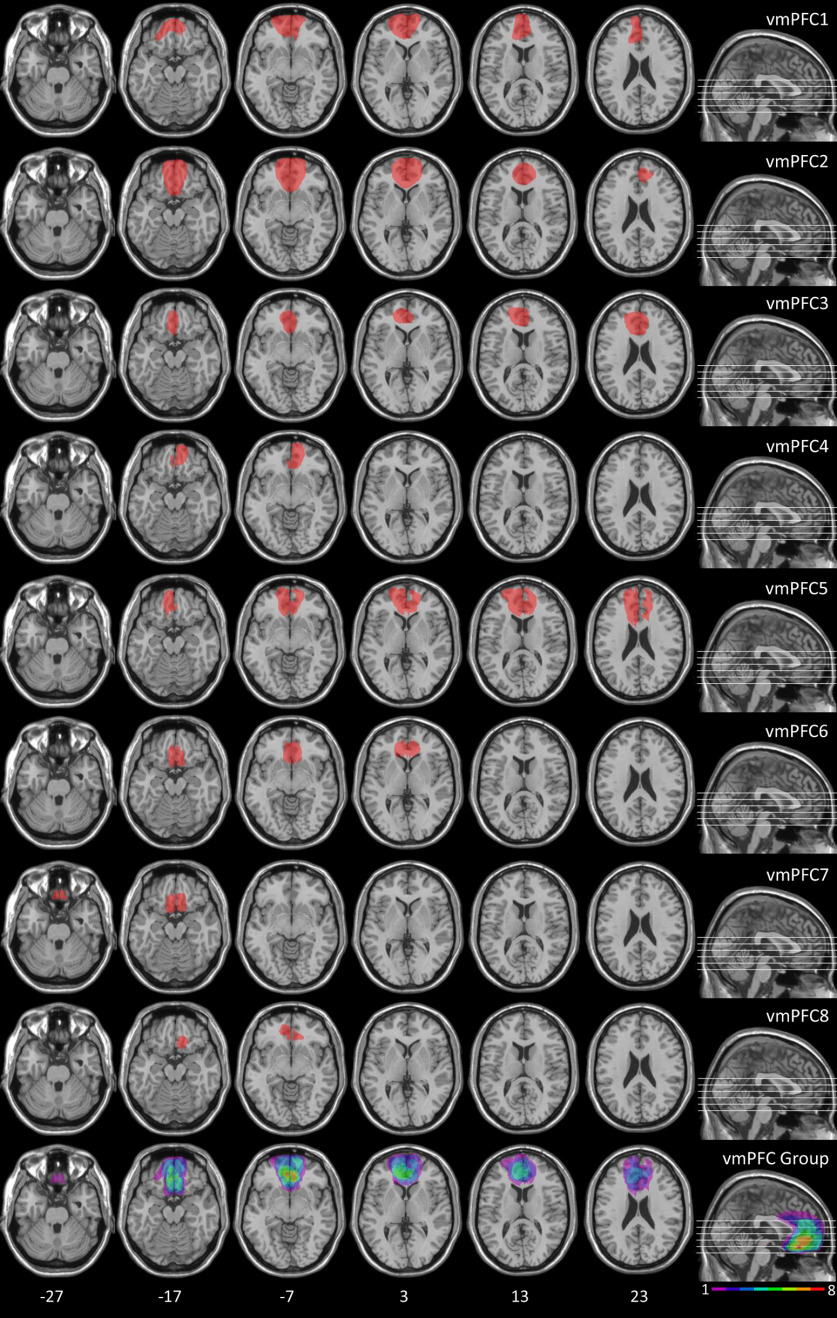
Figure 1.
Location and overlap of brain lesions of vmPFC patients. Representative axial slices showing individual patients' lesions, and representative axial slices and midsagittal view showing cumulative lesions overlap. The white horizontal lines on the sagittal view indicate the positions of the axial slices. The white numbers below the axial slices indicate the z-coordinates of each slice. The color bar indicates the number of overlapping lesions. The left hemisphere is on the left side. Maximal overlap occurs in BAs 10 and 11.

