Figure 3.

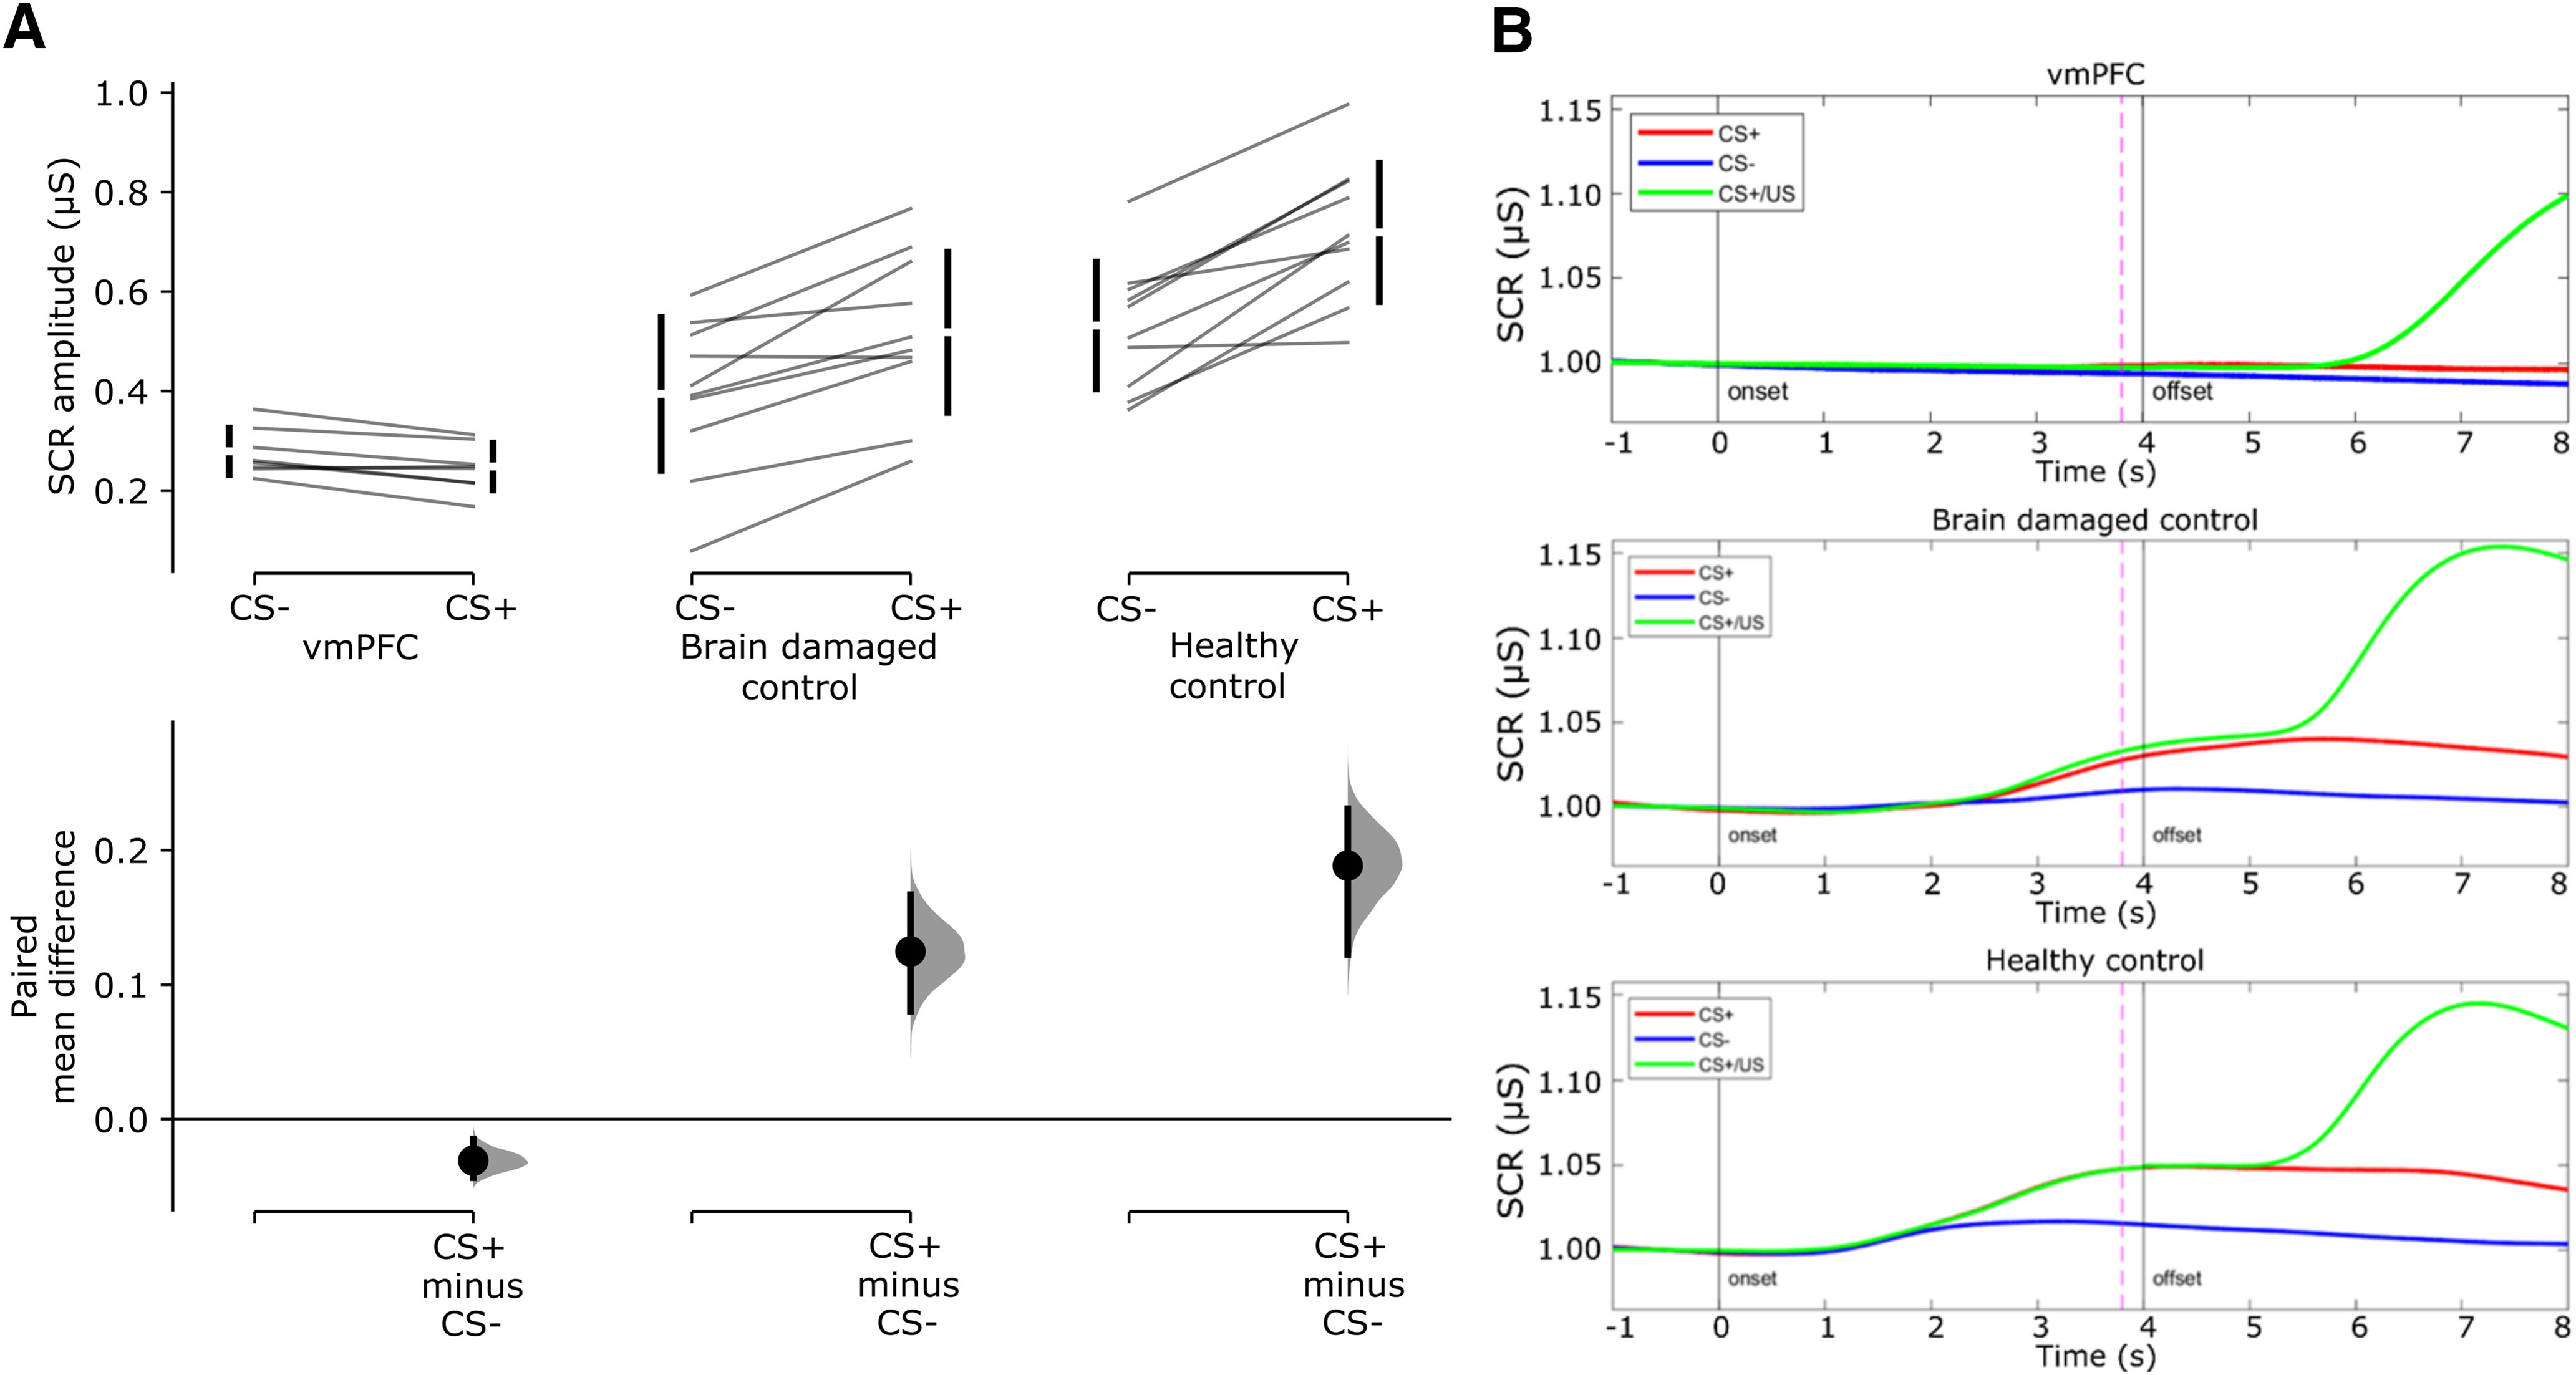
Acquisition of threat conditioning. A, Cumming estimation plots showing raw data and paired mean difference of SCR amplitude to CS+ and CS– for the vmPFC group, the brain-damaged control group, and the healthy control group. On the top axes, each paired set of observations is connected by a line. Also, 95% confidence intervals are indicated by vertical error bars, and group means are depicted as white gaps between the bars. On the lower axes, 95% confidence intervals are indicated by vertical error bars, and mean differences, plotted as a bootstrap sampling distribution (5000 samples), are depicted as dots. B, Grand average event-related SCR illustrates mean SCR over time to CS+ (no shock trials), CS– and CS+/US (shock trials). SCR is expressed as a proportion of the baseline (1 s before CS onset). Continuous vertical lines indicate the time of onset and offset of the CSs. Dashed line indicates shock onset in CS+/US trials.
