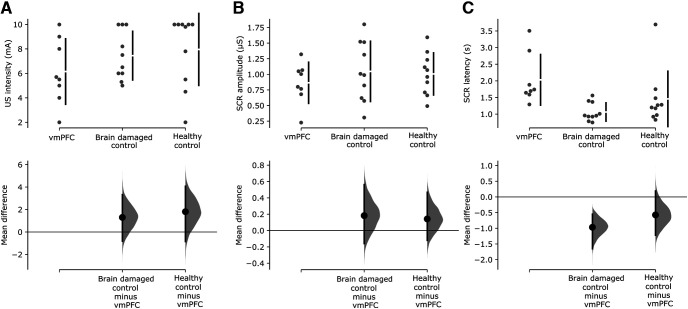
Figure 4.
US intensity, SCR amplitude, and latency to US. A–C, Cumming estimation plots showing raw data and mean difference of US intensity (A), SCR amplitude to the US (B), and SCR latency to the US (C) for the brain damaged control group and the healthy control group against the vmPFC group. On the top axes, 95% confidence intervals are indicated by vertical error bars and group means are depicted as white gaps between the bars. On the lower axes, 95% confidence intervals are indicated by vertical error bars and mean differences, plotted as a bootstrap sampling distribution (5000 samples), are depicted as dots.

