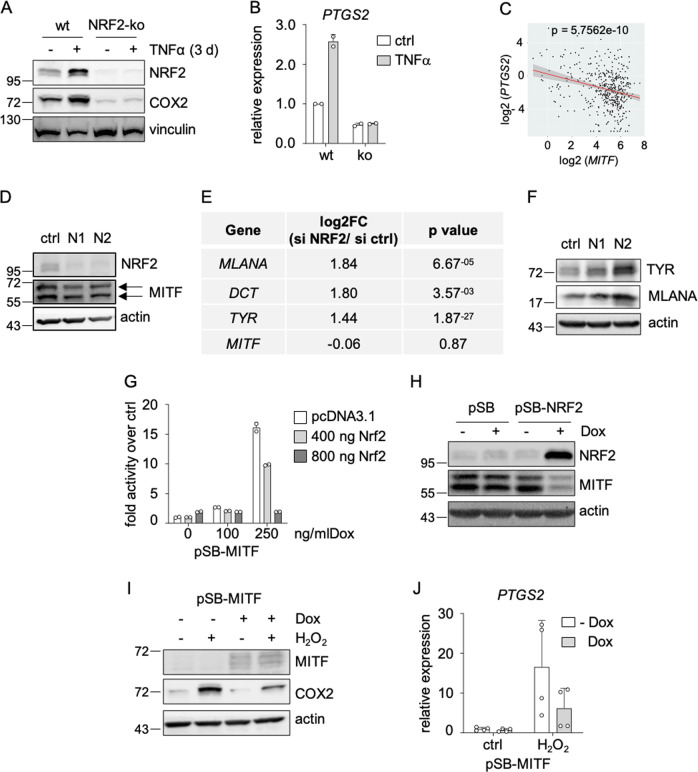
Fig. 4. Suppression of differentiation features by NRF2.
a Immunoblot of NRF2 and COX2 in UACC-62 NFE2L2 wt and NFE2L2 knockout cells after TNFα treatment (50 ng/ml, 3 d). Vinculin served as loading control. b Corresponding real-time PCR of PTGS2 gene expression, derived from two independent experiments. c Linear regression analysis of MITF and PTGS2 mRNA (n = 472) (Adj R2 = 0.076577 Intercept = 4.4372 Slope = −0.20477 p = 5.7562e-10). The results shown here are based upon data derived from the TCGA dataset Skin Cutaneous Melanoma, and FPKM values were downloaded from www.cbioportal.org. d Protein blot of NRF2 and MITF in UACC-62 cells after knockdown of NFE2L2 for 3 d with two independent siRNAs. MITF is represented by both visible bands (arrows). e Expression changes of pigmentation genes after NFE2L2 knockdown in UACC-62 cells, as detected by RNA sequencing, using the siRNA N2. f Protein blot of TYR and MLANA in UACC-62 cells after knockdown of NFE2L2 for 3 d with two independent siRNAs. g Luciferase assay of UACC-62 cells after MITF induction (100 or 250 ng/ml, 3 d) and co-transfection with 400 ng or 800 ng of pcDNA3.1-NRF2 and a tyrosinase promoter construct for 2 d. Luciferase activity was measured twice in duplicates. h Immunoblot of NRF2 and MITF after doxycycline-dependent NRF2 induction in UACC-62 cells (1000 ng/ml Dox, 3 d). Actin served as loading control. i Immunoblot of MITF and COX2 in UACC-62 cells expressing the Dox-inducible MITF expression vector pSB-MITF. Where indicated, cells were treated with doxycycline (250 ng/ml, 3 d) and H2O2 was added for the last 5 h before harvesting (400 µM). j Corresponding real-time PCR of PTGS2. Data are derived from two independent experiments performed in duplicates. Error bars represent SD.

