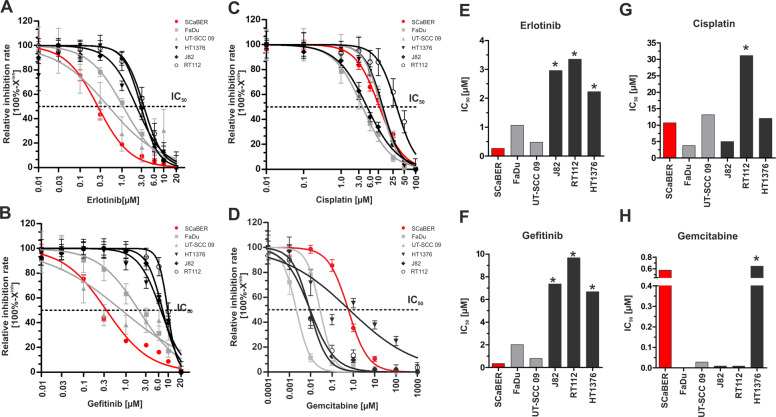
Fig. 2. Single drug response analyses applying anti-EGFR TKIs and chemotherapeutical agents on urothelial, squamous bladder, and squamous head and neck cancer cell lines.
a–d Semi-logarithmic plots show drug response curves (relative inhibition rate = 100%−Xinh) of urothelial bladder cancer cell lines (black lines; RT112, J82, HT1376), a squamous-differentiated bladder cancer cell line (red line; SCaBER) and head and neck cancer cell lines as controls (gray lines; UT-SCC 09 and FaDu) according to erlotinib (a), gefitinib (b), cisplatin (c), and gemcitabine (d). Drug response was determined using XTT following 72 h incubation with indicated drug concentrations. e–h Relative IC50 (drug concentration causing 50% inhibition) values are derived from the drug response curve to define the sensitivity of cell lines, respectively. (e) erlotinib, (f) gefitinib, (g) cisplatin and (h) gemcitabine. Drug-response curves represent means from at least n = 3 independent experiments. *Note: These cell lines did not achieve two assay concentrations at the lower plateau which results in underestimated IC50 values.

