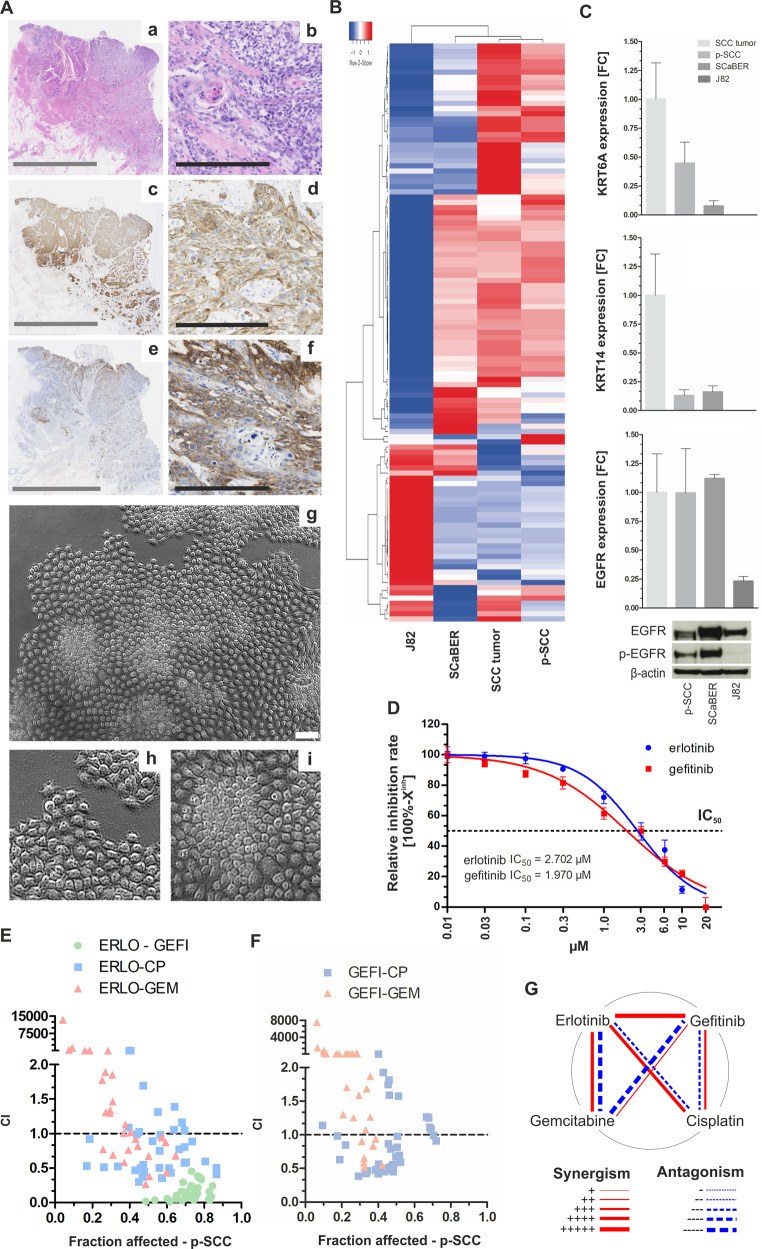
Fig. 6. Proof-of-principle of anti-EGFR based treatment of SCC by using primary SCC tumor cells.
a Histological (a–f) and morphological (g–i) characteristics of SCC and derived primary cells. a + b: HE staining of SCC tissue, c + d: Immunohistochemical anti-KRT5/6 staining, e + f: Immunohistochemical anti-EGFR staining, g–i Phase-contrast images of isolated SCC cells. Gray scale bar: 10 mm; black scale bar: 250 µm; white scale bar: 100 µm. b Heatmap of the 111 strongest regulated genes including KRT6A, KRT14, and TP63 illustrating a tight correlation between SCC and derived tumor cells (for detailed gene list see Supplementary Table 5). c Confirmation of KRT6A/14 and EGFR mRNA expression in p-SCC normalized to corresponding tumor tissue which is comparable with that of SCaBER cells. J82 served as non-basal control. GAPDH was used for standardization. FC: fold change. Vertical lines: + SEM of triplicates. d Single drug response analysis applying anti-EGFR TKIs after 72 h incubation. Drug-response curves showing relative inhibition rate (inhibition rate = 100%−Xinh) of p-SCC cells due to erlotinib and gefitinib treatment. e–f Graph illustrating CI results for fractions affected by combined application of indicated drugs (ERLO: erlotinib; GEFI: gefitinib; CP: cisplatin; GEM: gemcitabine) on p-SCC cells. Drugs were used at concentrations of 4× IC50, 2× IC50, 1× IC50, 0.5× IC50, 0.25× IC50, 0.125× IC50. CI = 1: additive effect, CI < 1: synergism, CI > 1: antagonism. Data represent means from n = 2 independent experiments. g Polygonograms summarize the effects (synergism/antagonism) according to Chou [37] of drug combinations for erlotinib, gefitinib, cisplatin and gemcitabine on p-SCC cells.

